344 penguins-lm
lm
en
regression
penguins
Schlüsselwörter
Aufgaben, Statistik, Prognose, Modellierung, R, Datenanalyse, Regression
344.1 Exercise
Consider the dataset penguins. Compute a linear model with body mass as output variable (DV) and flipper length as input (IV).
- Report the coefficients and interpret them.
- Plot the model and the coefficients.
- Report the model fit (R squared).
- BONUS:
predict()the weight of an average flipper-sized animal. Check out the internet for examples of how to do so in case you need support.
344.2 Solution
344.2.1 Setup
344.2.2 Let’s go
lm1 <- lm(body_mass_g ~ flipper_length_mm, data = penguins)Plot the model:
plot(estimate_relation(lm1))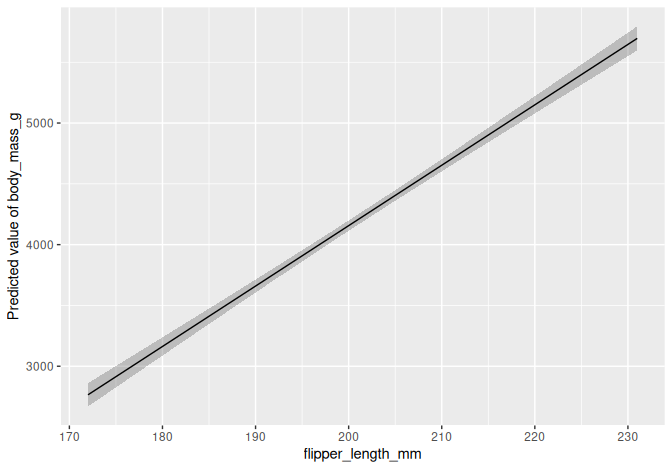
Alternative plotting method:
ggscatter(penguins,
          x = "flipper_length_mm",
          y = "body_mass_g",
          add ="reg.line")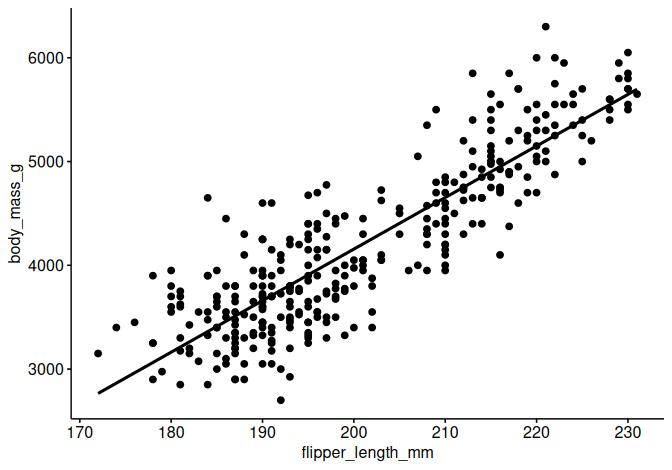
Coefficients (parameters):
parameters(lm1)Plot the coefficients:
plot(parameters(lm1))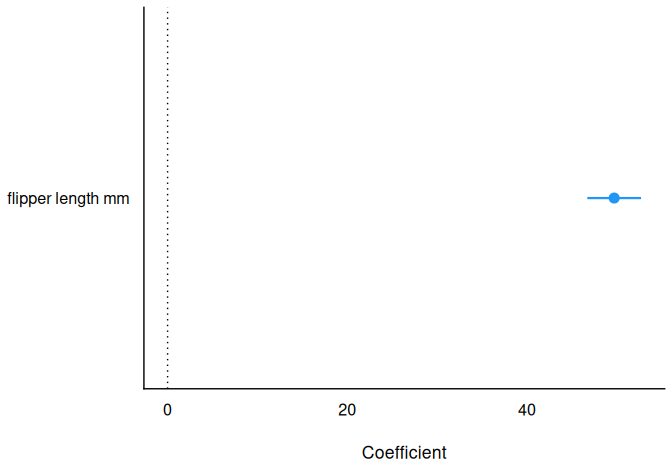
Model fit (explained variance by model):
r2(lm1)
## # R2 for Linear Regression
##        R2: 0.759
##   adj. R2: 0.758
Predict weight of average animal:
344.2.3 For average flipper length, what’s the expected weight?
predict(lm1, newdata = data.frame(flipper_length_mm = 200))
##    1
## 4156
Around 4 kgs.
344.2.4 Centering the data
Center the data:
penguins_c <-
  penguins |>
  mutate(flipper_length_mm_c = center(flipper_length_mm))
Now the mean value is (nearly) zero:
mean(penguins_c$flipper_length_mm_c, na.rm = TRUE)
## [1] -1.2e-14
Run the model again:
lm2 <- lm(body_mass_g ~ flipper_length_mm_c, data = penguins_c)

parameters(lm2)