208 Question
Schlüsselwörter
Aufgaben, Statistik, Prognose, Modellierung, R, Datenanalyse, Regression
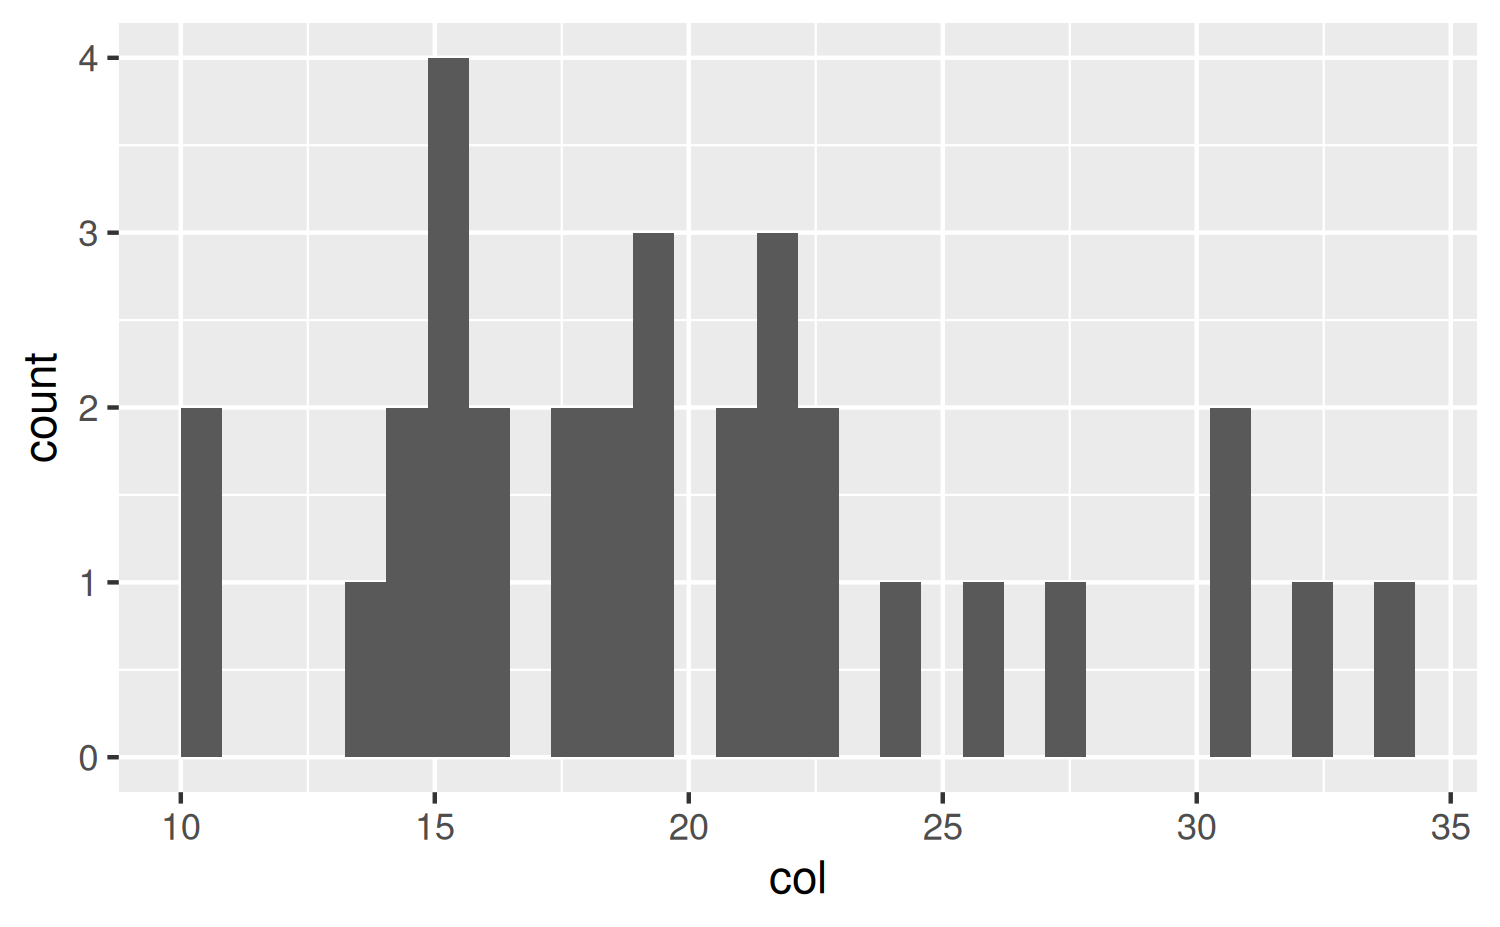
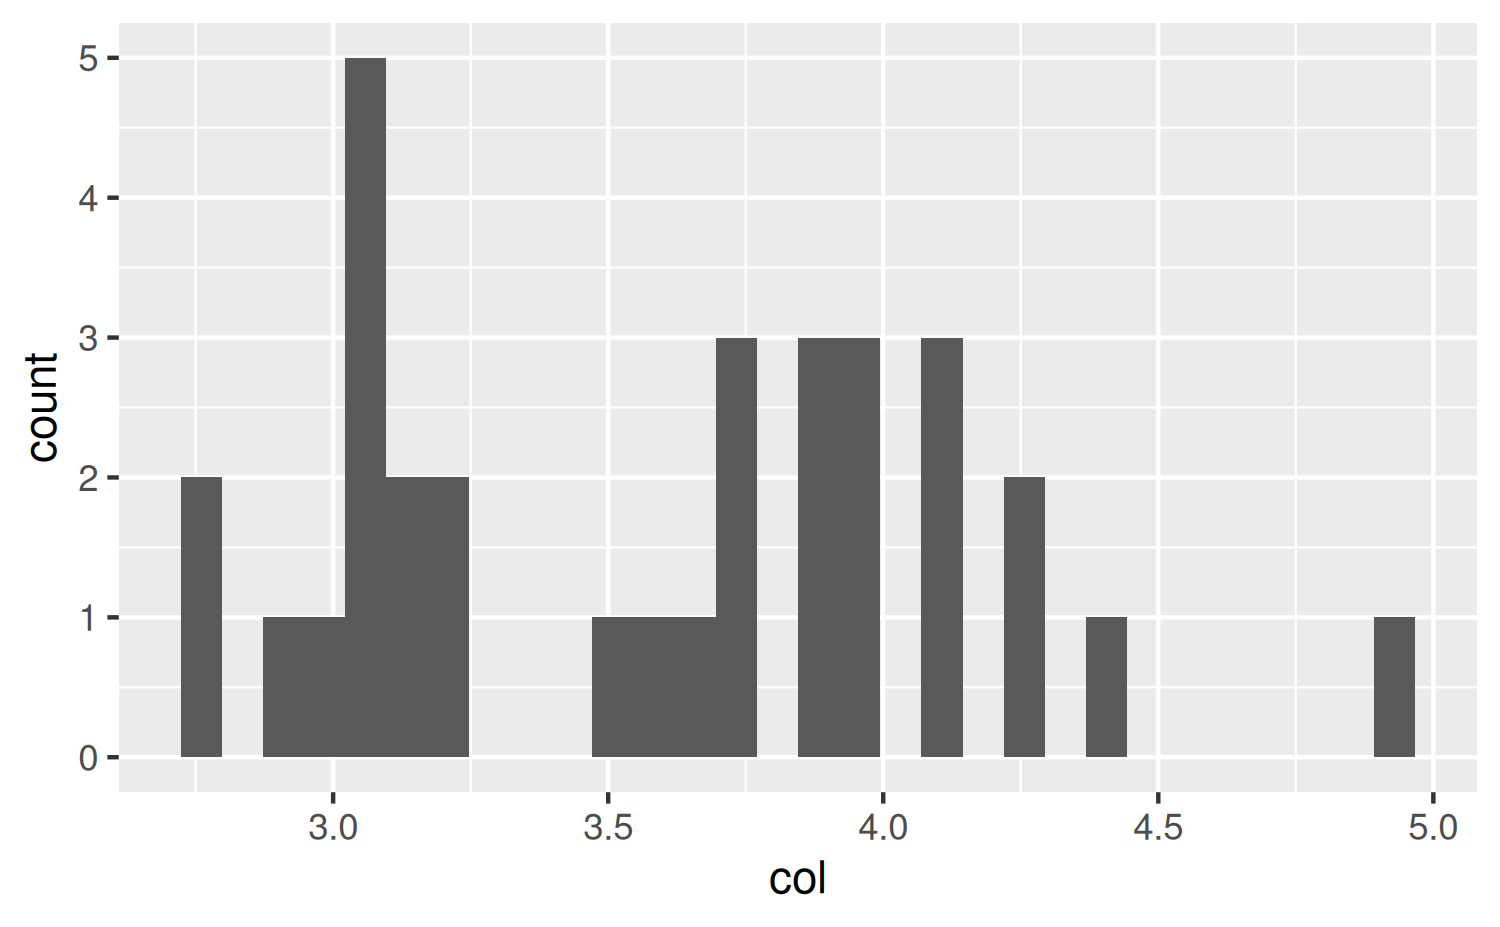
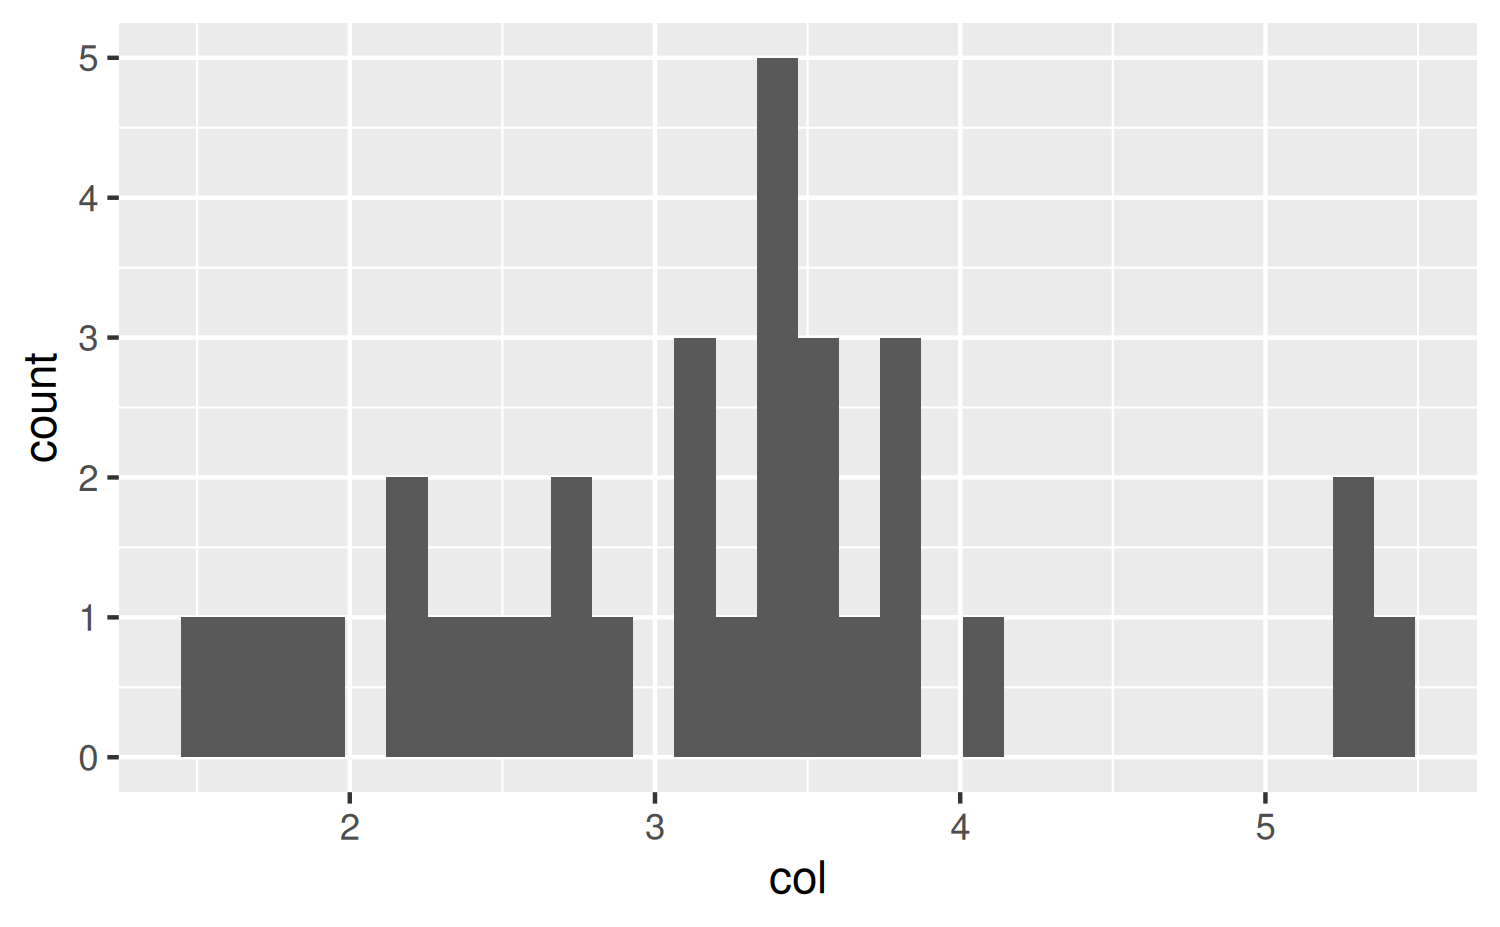
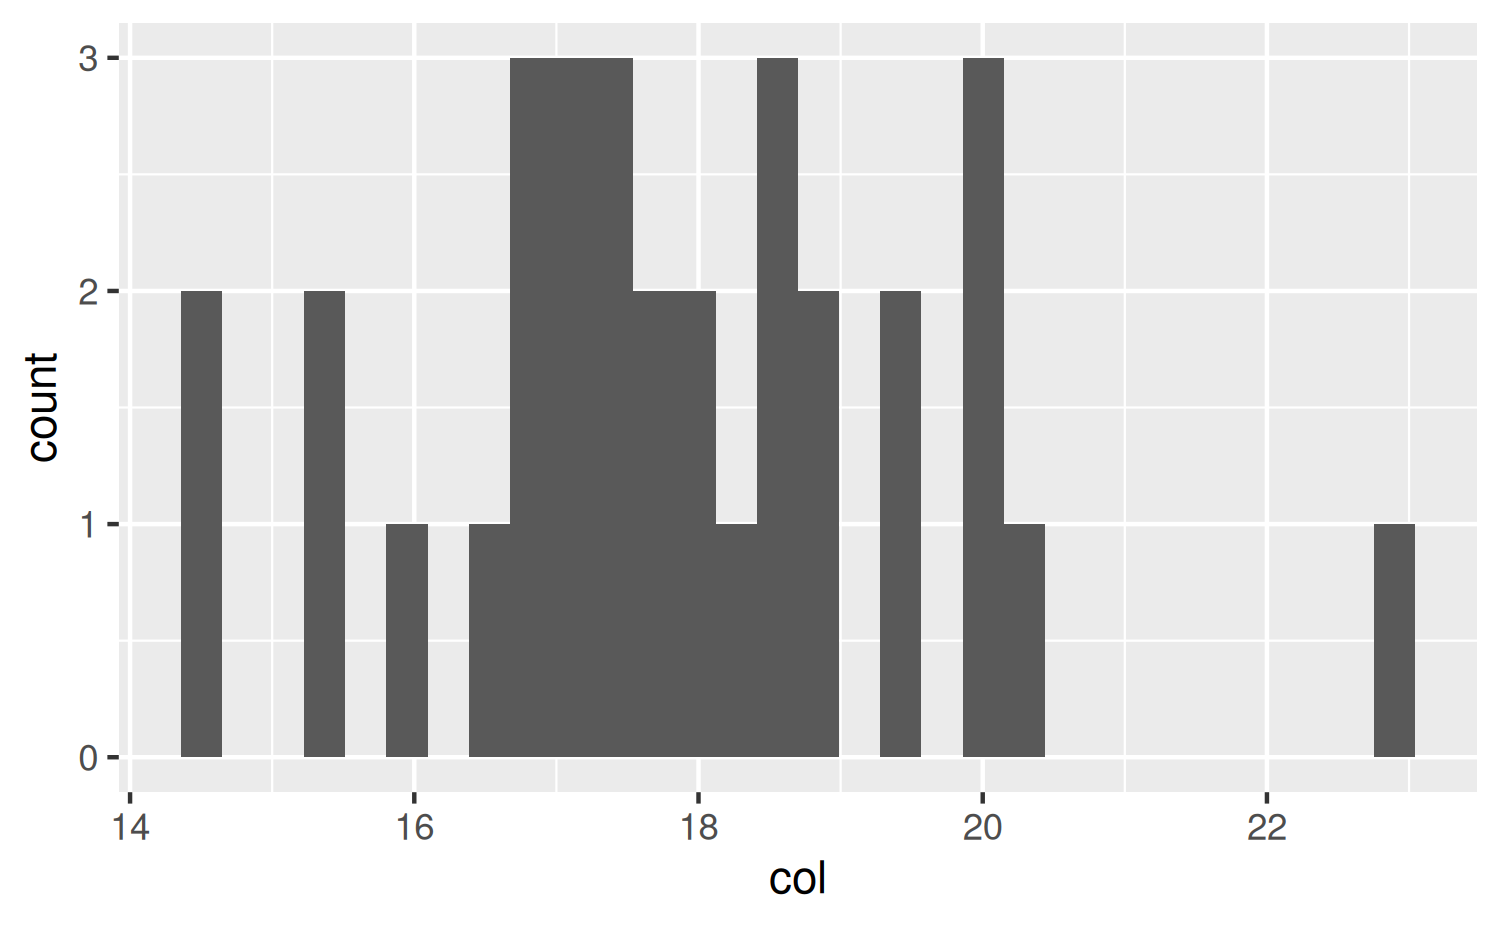
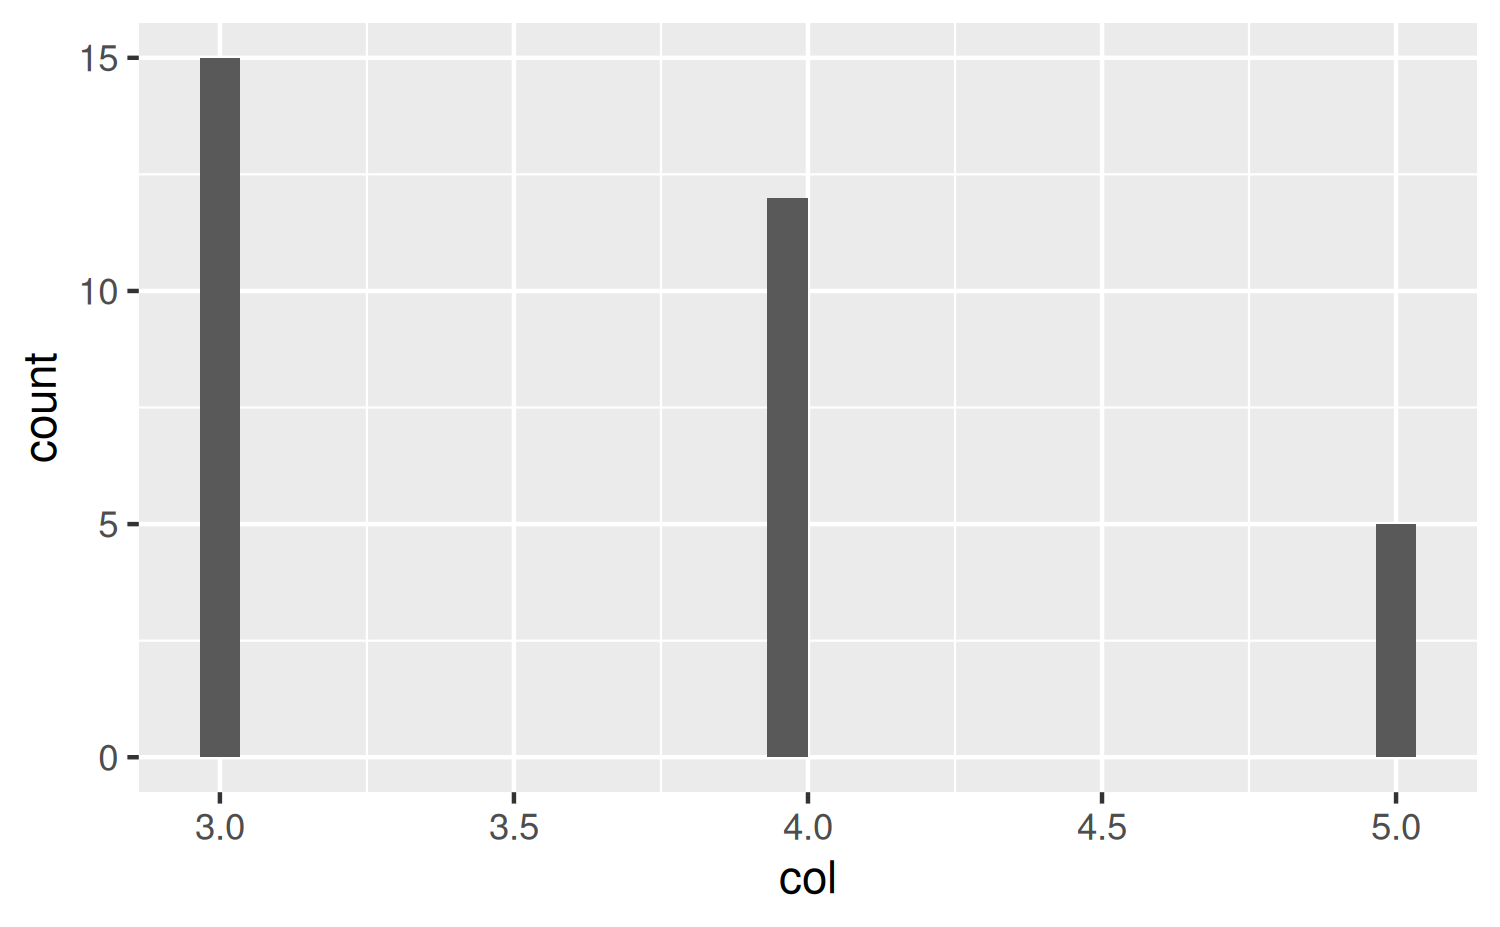
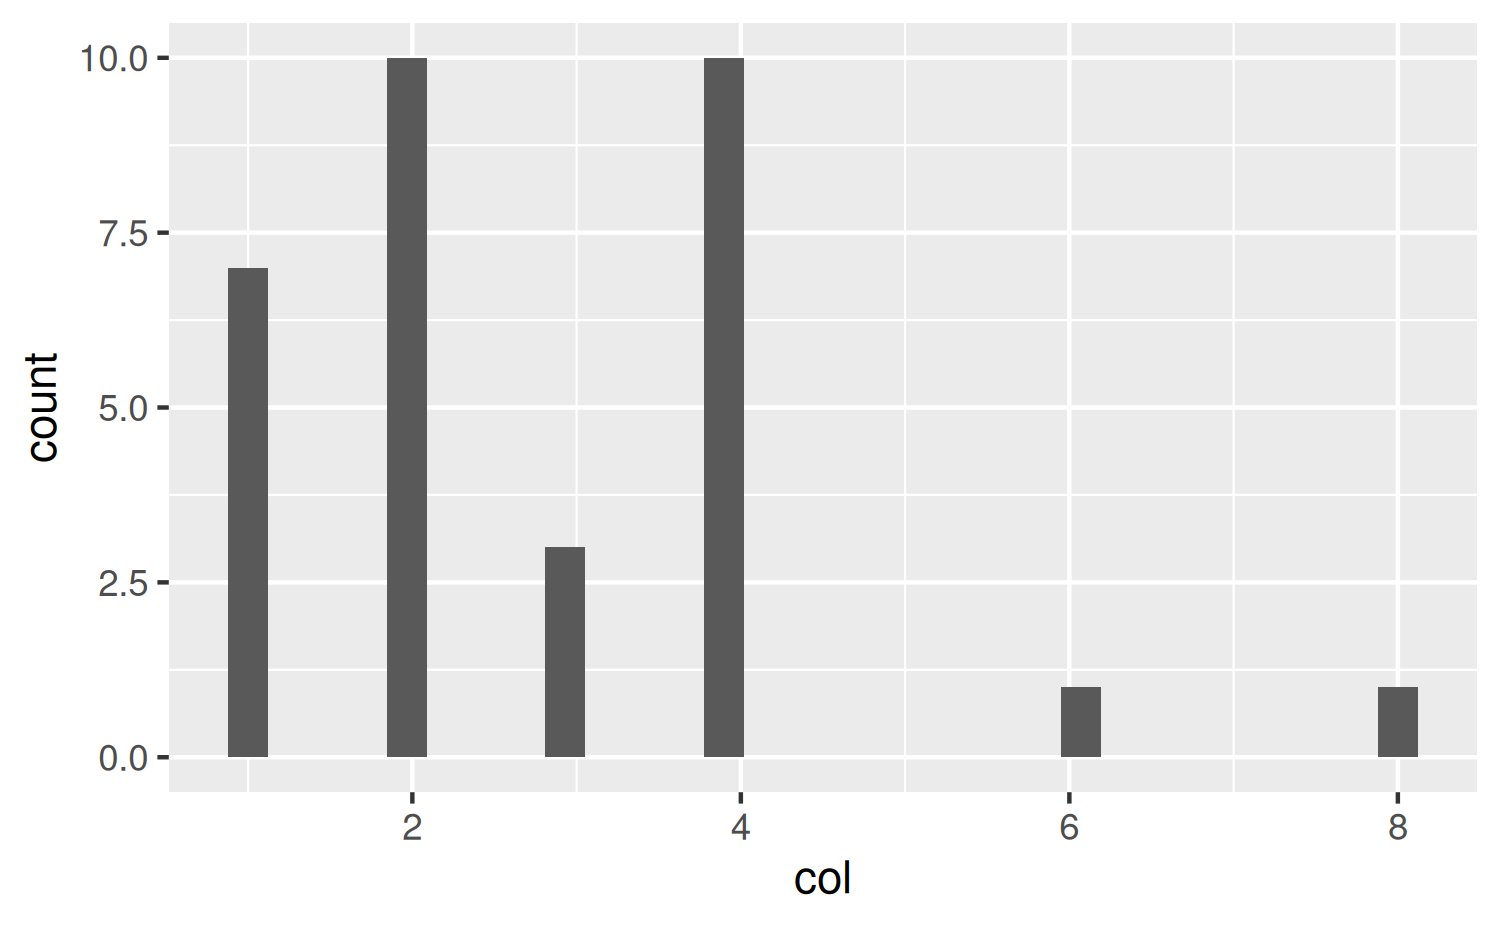
Erstellen Sie für jede Variable aus mtcars ein Histogramm!
Hinweise:
- Nutzen Sie eine Wiederholungsstruktur. Schreiben Sie prägnante Syntax.
- Optional: Lassen Sie dichotome (zweiwertige) Variablen aus.
- Hier (und an vielen anderen Stellen im Netz) finden Sie Tipps.
209 Solution
mtcars_hist <- function(col){
  mtcars %>%
    ggplot(aes(x = col)) +
    geom_histogram()
}
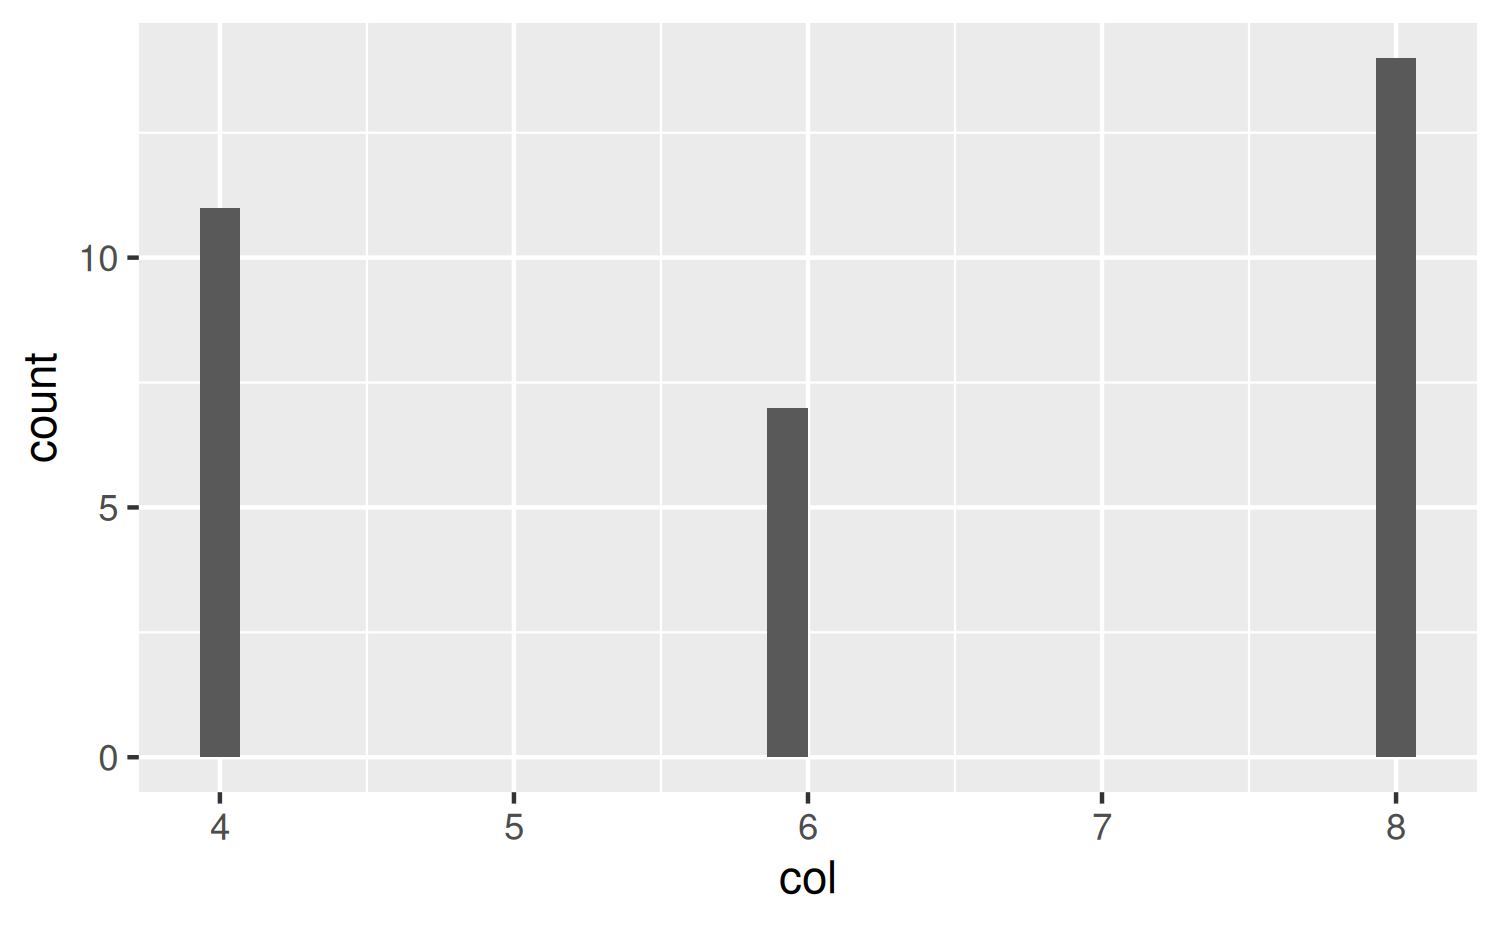
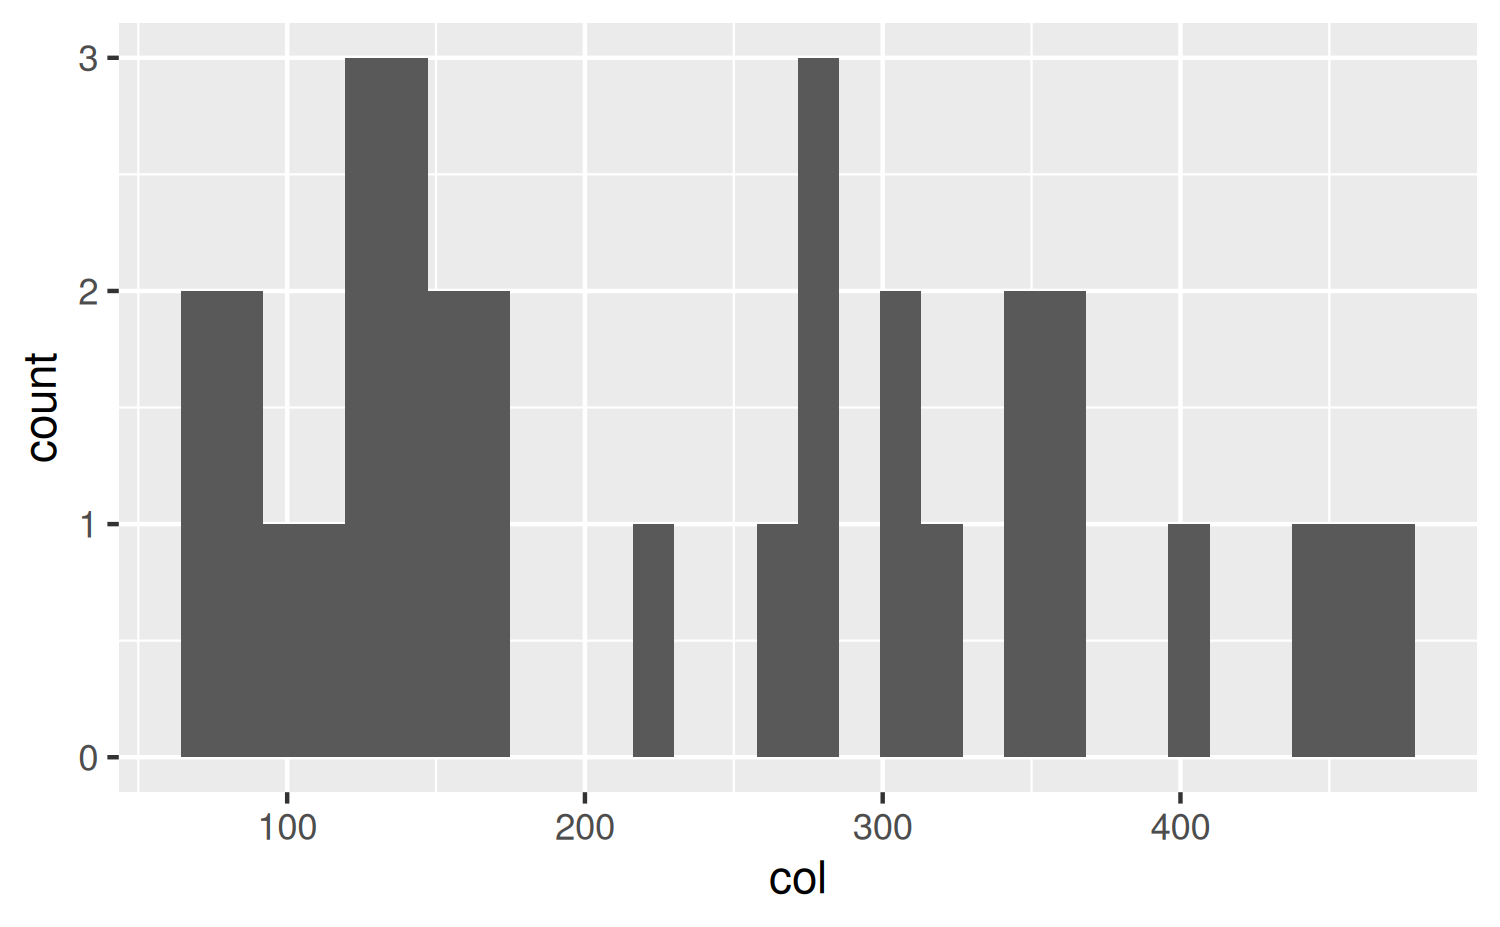
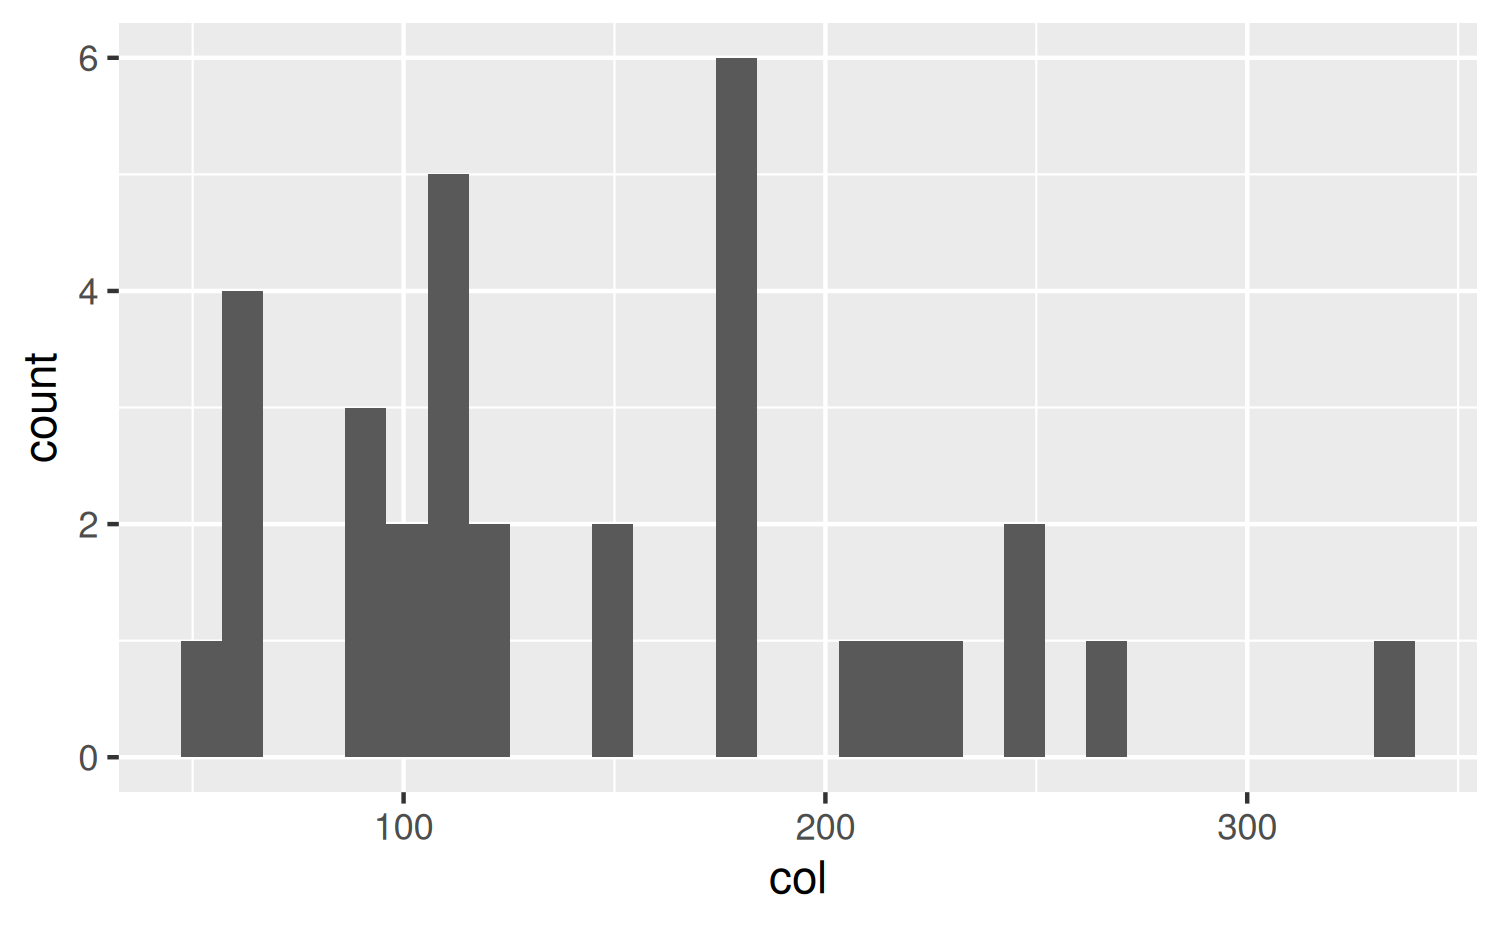
210 Meta-information
extype: string exsolution: NA exname: ggplot-prog expoints: 1