198 Question
Schlüsselwörter
Aufgaben, Statistik, Prognose, Modellierung, R, Datenanalyse, Regression
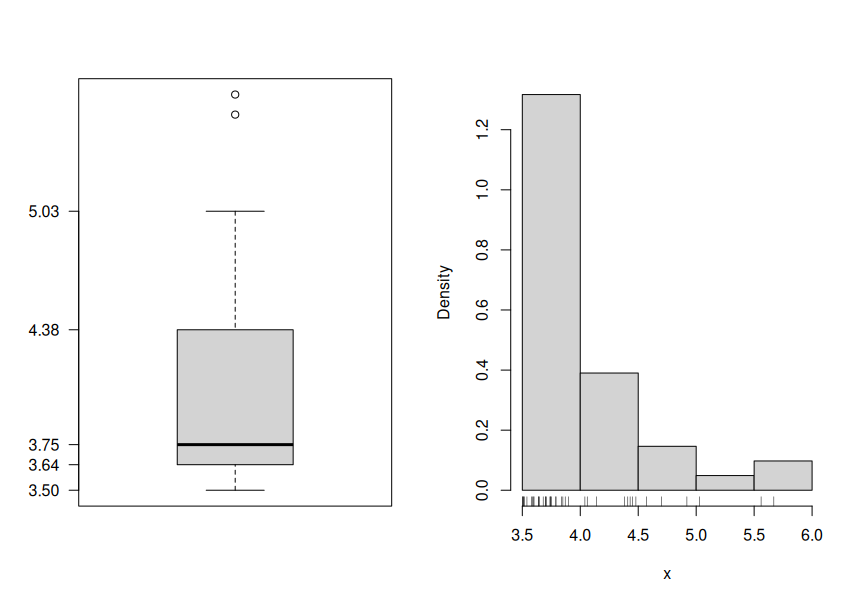
For the 41 observations of the variable x in the data file boxhist.csv draw a histogram, a boxplot and a stripchart. Based on the graphics, answer the following questions or check the correct statements, respectively. (Comment: The tolerance for numeric answers is \(\pm0.09\), the true/false statements are either about correct or clearly wrong.)
| The distribution is unimodal: | ##ANSWER1## |
| The distribution is: | ##ANSWER2## |
| The boxplot shows outliers: | ##ANSWER3## |
| A quarter of the observations is smaller than: | ##ANSWER4## |
| A quarter of the observations is greater than: | ##ANSWER5## |
| Half of the observations are greater than: | ##ANSWER6## |
199 Solution
200 Meta-information
extype: cloze exsolution: 10|010|10|3.64|4.38|3.75 exclozetype: schoice|schoice|schoice|num|num|num exname: boxhist2 extol: 0|0|0|0.09|0.09|0.09