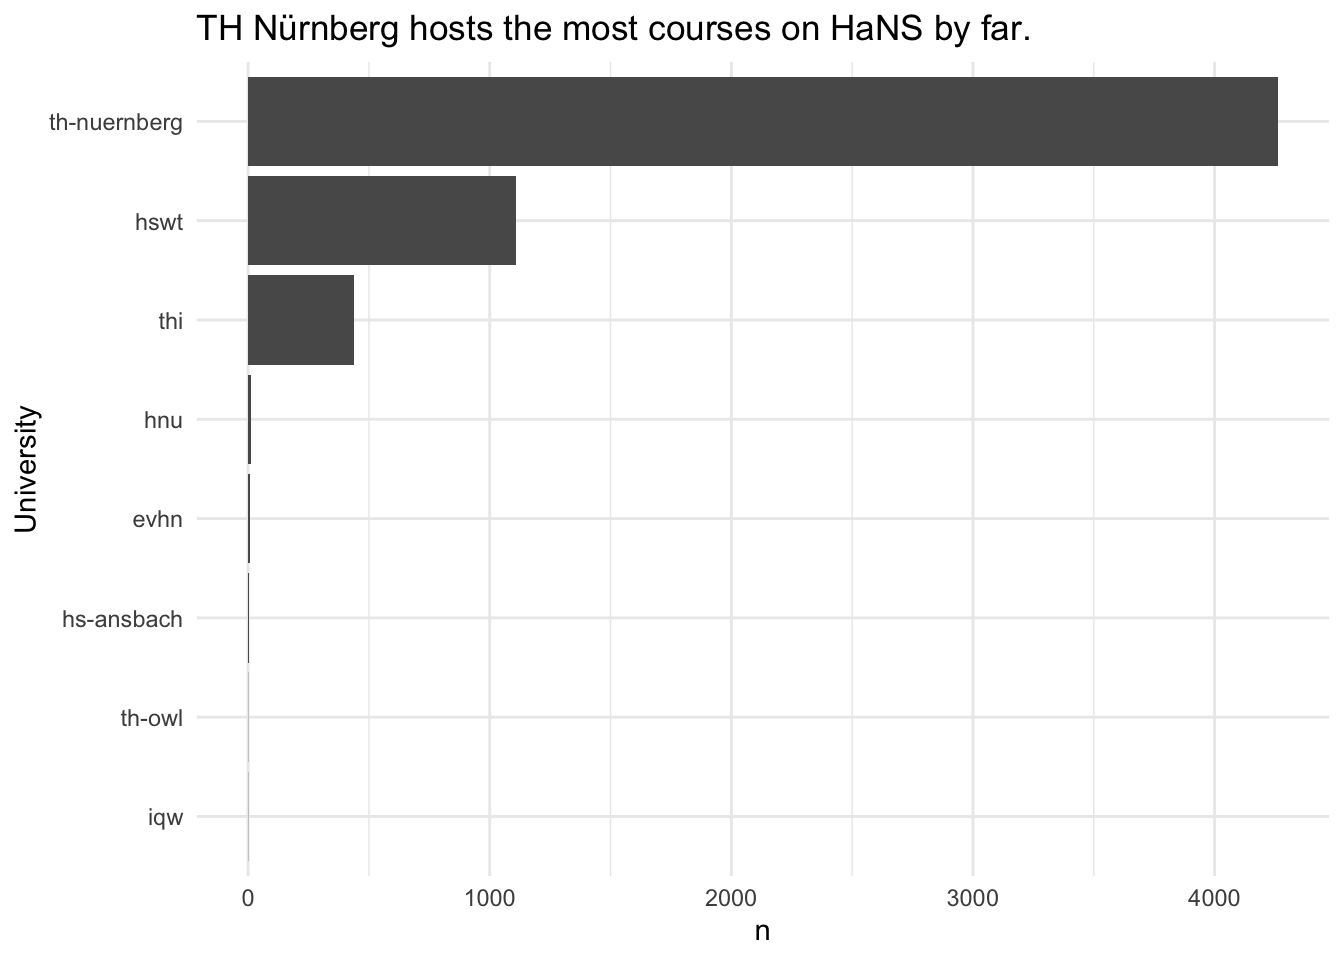
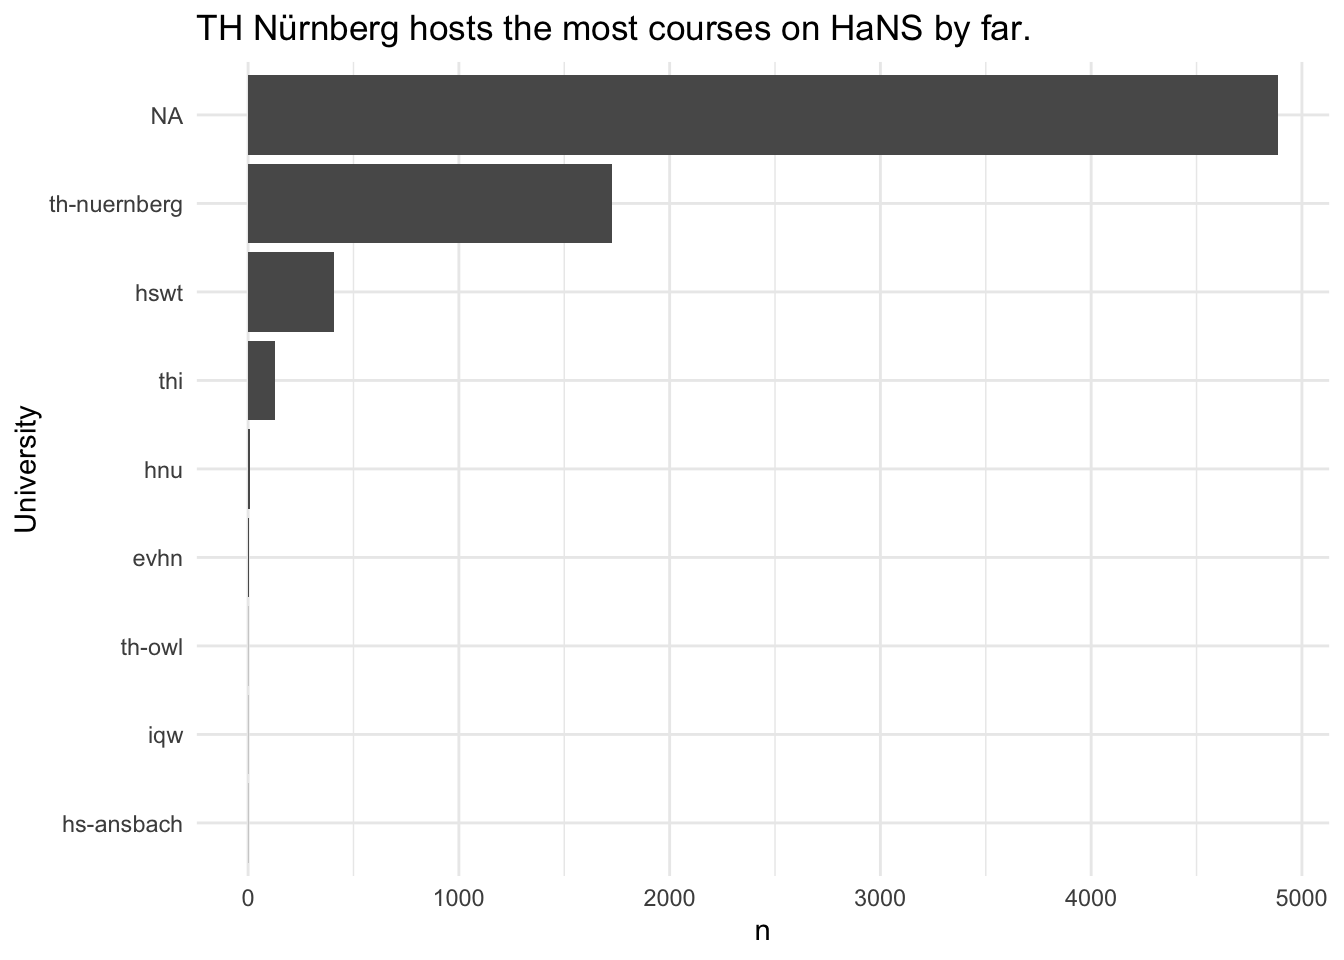
course_and_uni_per_visit|>distinct(fingerprint, .keep_all =TRUE)|>count(university)|>ggplot(aes(y =reorder(university, n), x =n))+geom_col()+theme_minimal()+labs( title ="TH Nürnberg hosts the most courses on HaNS by far.", y ="University")
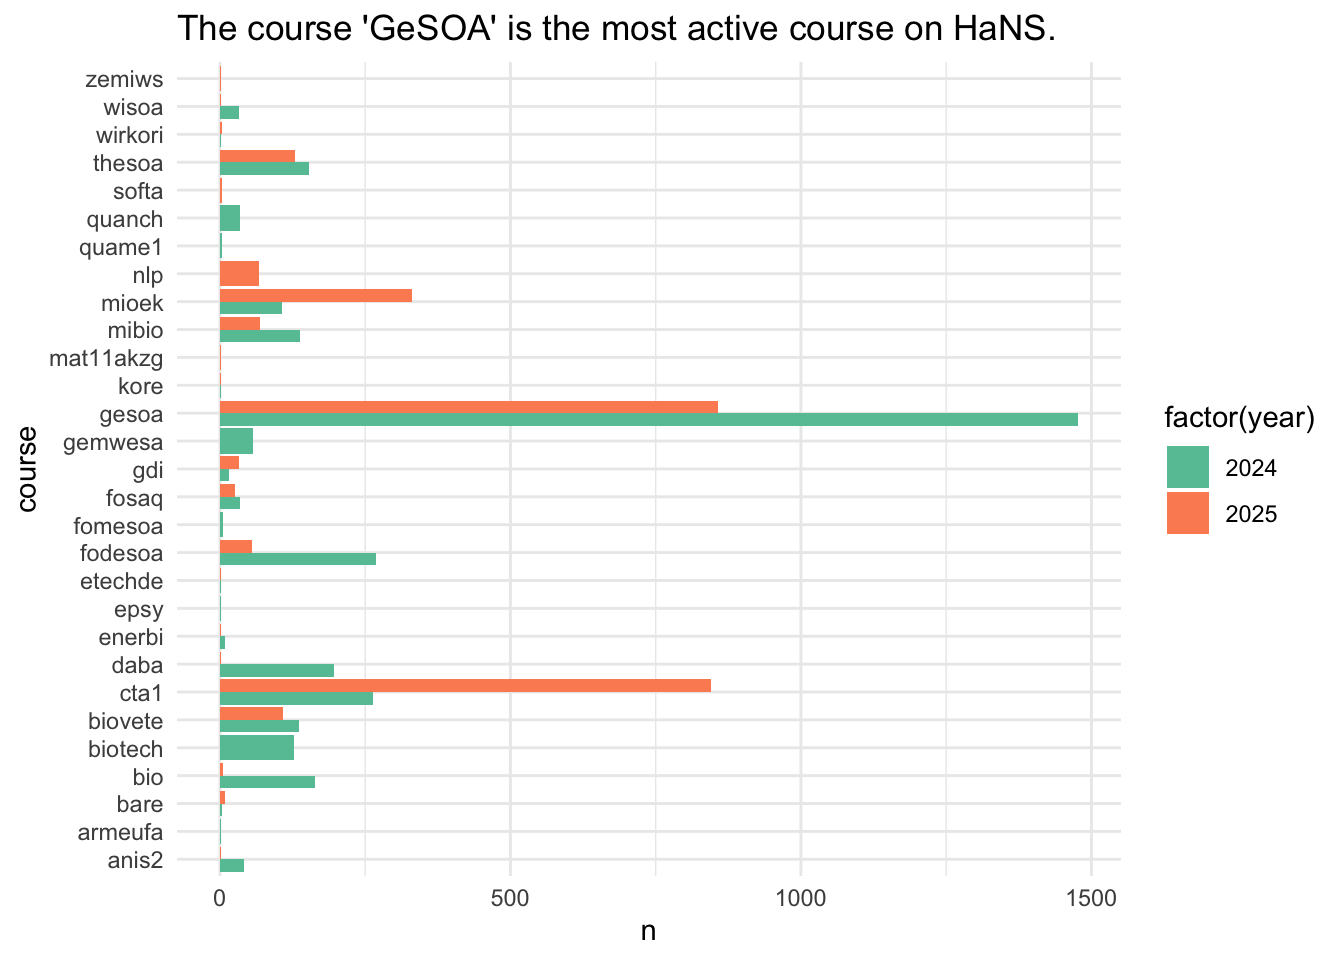
time_spent_w_course_university|>count(year, course)|>drop_na()|>ggplot(aes(x =n, y =course, fill =factor(year), ))+geom_col(position ="dodge")+labs(title ="The course 'GeSOA' is the most active course on HaNS.")
9.3.2 fingerprint unique
Show the code
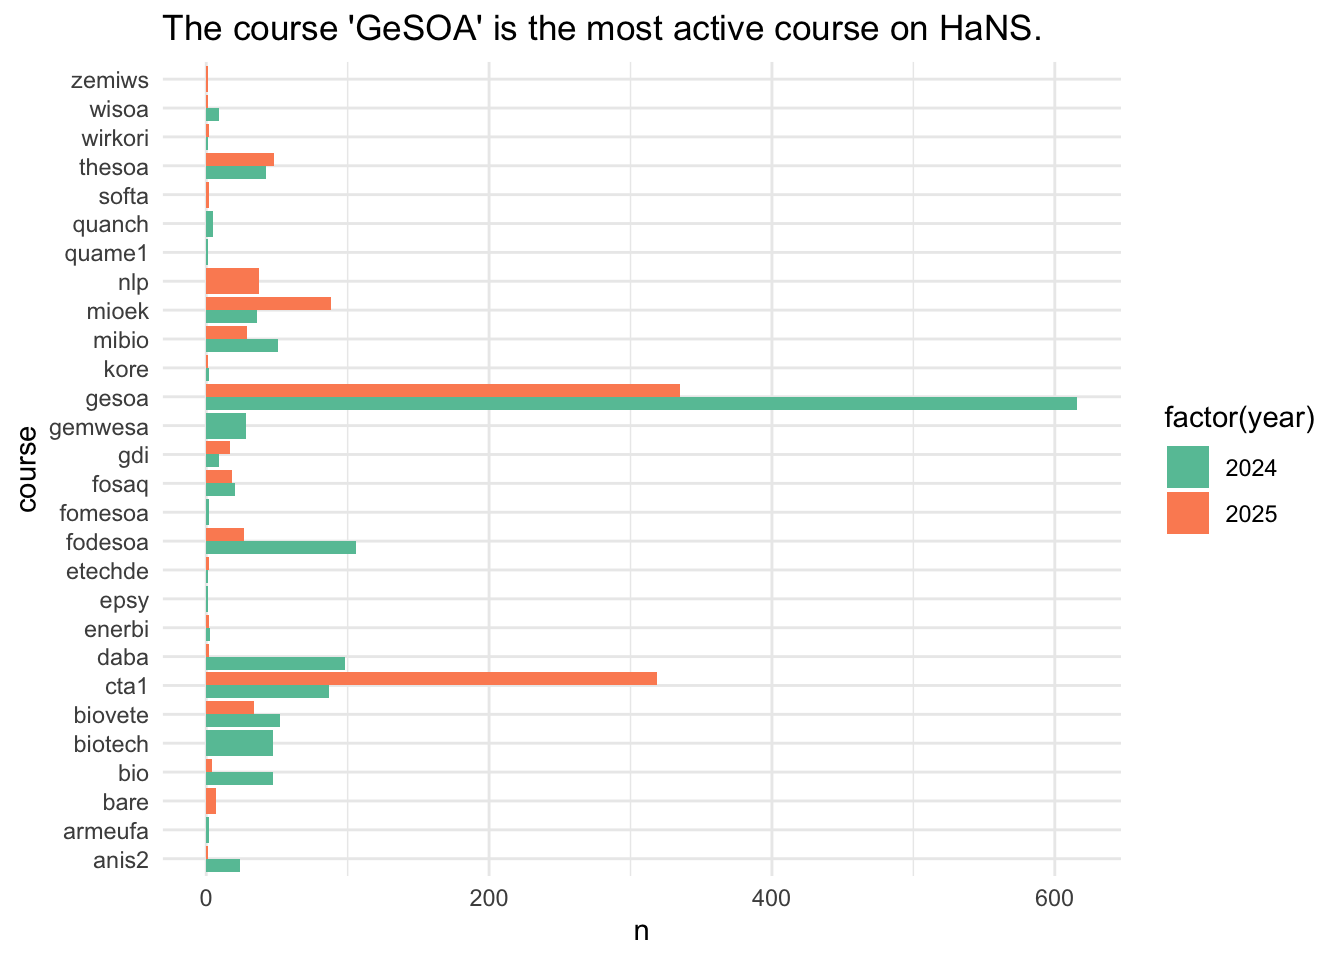
time_spent_w_course_university|>distinct(fingerprint, .keep_all =TRUE)|>count(year, course)|>drop_na()|>ggplot(aes(x =n, y =course, fill =factor(year), ))+geom_col(position ="dodge")+labs(title ="The course 'GeSOA' is the most active course on HaNS.")
Quellcode
# Effekte von Lehrveranstaltungen und Hochschulen ## Setup```{r libs}library(tidyverse)#library(lubridate)#library(gt)library(targets)#library(ggpubr)#library(scales)# library(ggfittext)library(easystats)#library(data.table)#library(tinytable)# library(ggokabeito)``````{r source-common-start}source("_common.r")``````{r load-targets}tar_load(c( course_and_uni_per_visit, time_spent_w_course_university))```## Anzahl an Lehrveranstaltungen nach Hochschule### idvisit```{r course_and_uni_per_visit-count}course_and_uni_per_visit |>count(university)``````{r course_and_uni_per_visit_plot}course_and_uni_per_visit |>count(university) |>drop_na() |>ggplot(aes(y =reorder(university, n), x = n)) +geom_col() +theme_minimal() +labs(title ="TH Nürnberg hosts the most courses on HaNS by far.",y ="University" )```### fingerprint unique```{r course_and_uni_per_visit_plot_fingerprint}course_and_uni_per_visit |>distinct(fingerprint, .keep_all =TRUE) |>count(university) |>ggplot(aes(y =reorder(university, n), x = n)) +geom_col() +theme_minimal() +labs(title ="TH Nürnberg hosts the most courses on HaNS by far.",y ="University" )```## Visits nach Lehrveranstaltung pro Jahr### idvisit```{r time_spent_w_course_university_count}time_spent_w_course_university |>count(year, course)``````{r ime_spent_w_course_university_count_plot}time_spent_w_course_university |>count(year, course) |>drop_na() |>ggplot(aes(x = n, y = course, fill =factor(year), )) +geom_col(position ="dodge") +labs(title ="The course 'GeSOA' is the most active course on HaNS.")```### fingerprint unique```{r time_spent_w_course_university_count_plot_fingerprint}time_spent_w_course_university |>distinct(fingerprint, .keep_all =TRUE) |>count(year, course) |>drop_na() |>ggplot(aes(x = n, y = course, fill =factor(year), )) +geom_col(position ="dodge") +labs(title ="The course 'GeSOA' is the most active course on HaNS.")```