Often, we want to check for missing values (NAs). There are of course many ways to do so. dplyr provides a quite nice one.

First, let’s load some data:

library(readr)
extra_file <- "https://raw.github.com/sebastiansauer/Daten_Unterricht/master/extra.csv"

extra_df <- read_csv(extra_file)

Note that extra is a data frame consisting of survey items regarding extraversion and related behavior.

In case the dataframe is quite largish (many columns) it is helpful to have some quick way. Here, we have 25 columns. That is not enormous, but ok, let’s stick with that for now.

library(dplyr)

extra_df %>% 
  select_if(function(x) any(is.na(x))) %>% 
  summarise_each(funs(sum(is.na(.)))) -> extra_NA

So, what have we done? The select_if part choses any column where is.na is true (TRUE). Then we take those columns and for each of them, we sum up (summarise_each) the number of NAs. Note that each column is summarized to a single value, that’s why we use summarise. And finally, the resulting data frame (dplyr always aims at giving back a data frame) is stored in a new variable for further processing.

Now, let’s see:

# library(pander)  # for printing tables in markdown
library(knitr)

kable(extra_NA)
code i6 i9 i12 Facebook Kater Alter Geschlecht extro_one_item Minuten Messe Party Kunden Beschreibung Aussagen i26 extra_mw
82 1 1 1 73 12 3 3 4 37 4 16 49 117 121 3 3

Subsetting a data frame is an essential and frequently performed task. Here, some basic ideas are presented.

Get some data first.

str(mtcars)
## 'data.frame':	32 obs. of  11 variables:
##  $ mpg : num  21 21 22.8 21.4 18.7 18.1 14.3 24.4 22.8 19.2 ...
##  $ cyl : num  6 6 4 6 8 6 8 4 4 6 ...
##  $ disp: num  160 160 108 258 360 ...
##  $ hp  : num  110 110 93 110 175 105 245 62 95 123 ...
##  $ drat: num  3.9 3.9 3.85 3.08 3.15 2.76 3.21 3.69 3.92 3.92 ...
##  $ wt  : num  2.62 2.88 2.32 3.21 3.44 ...
##  $ qsec: num  16.5 17 18.6 19.4 17 ...
##  $ vs  : num  0 0 1 1 0 1 0 1 1 1 ...
##  $ am  : num  1 1 1 0 0 0 0 0 0 0 ...
##  $ gear: num  4 4 4 3 3 3 3 4 4 4 ...
##  $ carb: num  4 4 1 1 2 1 4 2 2 4 ...
mtcars <- head(mtcars)  # for shorter output
mtcars
##                    mpg cyl disp  hp drat    wt  qsec vs am gear carb
## Mazda RX4         21.0   6  160 110 3.90 2.620 16.46  0  1    4    4
## Mazda RX4 Wag     21.0   6  160 110 3.90 2.875 17.02  0  1    4    4
## Datsun 710        22.8   4  108  93 3.85 2.320 18.61  1  1    4    1
## Hornet 4 Drive    21.4   6  258 110 3.08 3.215 19.44  1  0    3    1
## Hornet Sportabout 18.7   8  360 175 3.15 3.440 17.02  0  0    3    2
## Valiant           18.1   6  225 105 2.76 3.460 20.22  1  0    3    1

One: Addressing dataframe as list (vector, 1-dim structure)

Data frames can be understood/addressed as lists, ie., as some type of vectors. Vectors have one dimension. Thus, we can access/subset with one index only (one dimension). For example mtcars[1] selects the first element (ie., column) of mtcars.

mtcars[1]
##                    mpg
## Mazda RX4         21.0
## Mazda RX4 Wag     21.0
## Datsun 710        22.8
## Hornet 4 Drive    21.4
## Hornet Sportabout 18.7
## Valiant           18.1
mtcars["mpg"]
##                    mpg
## Mazda RX4         21.0
## Mazda RX4 Wag     21.0
## Datsun 710        22.8
## Hornet 4 Drive    21.4
## Hornet Sportabout 18.7
## Valiant           18.1
mtcars[c("mpg", "cyl")]  
##                    mpg cyl
## Mazda RX4         21.0   6
## Mazda RX4 Wag     21.0   6
## Datsun 710        22.8   4
## Hornet 4 Drive    21.4   6
## Hornet Sportabout 18.7   8
## Valiant           18.1   6
mtcars[1:3]
##                    mpg cyl disp
## Mazda RX4         21.0   6  160
## Mazda RX4 Wag     21.0   6  160
## Datsun 710        22.8   4  108
## Hornet 4 Drive    21.4   6  258
## Hornet Sportabout 18.7   8  360
## Valiant           18.1   6  225

Note that data frames are vectors (lists) technically, where the vectors are the columns and the columns possess names. Thus we can address the columns by their names. Of course, we can select (address/index/subset) more than one element (column) using the c() function.

Besides names, we can address the elements by their number: type a positive integer to subset the respective element. c can be used here too.

Note that the : (colon) operator is a short hand for c(from_this_column_to_that column).

Similarly to addressing the names of the data frames using brackets [], we can use the Dollar $ operator:

mtcars$mpg
## [1] 21.0 21.0 22.8 21.4 18.7 18.1

Whatever comes after the $ is understood by R as the name (without quotation marks) of the column within that data frame. $ is a shorthand for [[]] (but not exactly the same; see here for an excellent overview).

Two: Addressing dataframe as a matrix (2-dim-structure, 2-dim-matrix)

As data frames can also be addressed as rectangular, two-dimensional matrices, we may subset specific elements using a x-y-coordinate scheme where in R matrices the row is addressed first, and the column second, eg., mtcars(1,2) would be first line of second column.

mtcars[1,1]
## [1] 21
mtcars[1, c(1,2)]
##           mpg cyl
## Mazda RX4  21   6
mtcars[1, 1:3]
##           mpg cyl disp
## Mazda RX4  21   6  160
mtcars[1, c(1:3)]
##           mpg cyl disp
## Mazda RX4  21   6  160
mtcars[, c(1:3)]
##                    mpg cyl disp
## Mazda RX4         21.0   6  160
## Mazda RX4 Wag     21.0   6  160
## Datsun 710        22.8   4  108
## Hornet 4 Drive    21.4   6  258
## Hornet Sportabout 18.7   8  360
## Valiant           18.1   6  225
mtcars[1, "mpg"]
## [1] 21
mtcars[1, c("mpg", "cyl")]  
##           mpg cyl
## Mazda RX4  21   6

Again, the c() operator may be used to group several rows or columns. Columns may again addressed by their names (row names are unusual). The : colon operator is allowed, too.

Three: Logical subsetting in dataframes

mtcars[c(T, T, F, F, F, F, F, F, F, F, T)]
##                    mpg cyl carb
## Mazda RX4         21.0   6    4
## Mazda RX4 Wag     21.0   6    4
## Datsun 710        22.8   4    1
## Hornet 4 Drive    21.4   6    1
## Hornet Sportabout 18.7   8    2
## Valiant           18.1   6    1
mtcars[c(T, T, F)]
##                    mpg cyl  hp drat  qsec vs gear carb
## Mazda RX4         21.0   6 110 3.90 16.46  0    4    4
## Mazda RX4 Wag     21.0   6 110 3.90 17.02  0    4    4
## Datsun 710        22.8   4  93 3.85 18.61  1    4    1
## Hornet 4 Drive    21.4   6 110 3.08 19.44  1    3    1
## Hornet Sportabout 18.7   8 175 3.15 17.02  0    3    2
## Valiant           18.1   6 105 2.76 20.22  1    3    1

In the first example above, the columns #1, #2, #and #11 are selected, because their position is indexed as TRUE (or T).

Note that if you supply less elements than the length of the objects (eg., here 11 columns/elements), R will recycle your elements until the full length of the element is met (here: TTF-TTF-TTF-TT).

Again, the data frame can be addressed either as a list (1-dim), or as a 2-dim matrix. See here for an example using logical indexing and addressing the data frame as a 2-dim matrix:

mtcars[c(T, T, F), c(T, T, F)]
##                    mpg cyl  hp drat  qsec vs gear carb
## Mazda RX4         21.0   6 110 3.90 16.46  0    4    4
## Mazda RX4 Wag     21.0   6 110 3.90 17.02  0    4    4
## Hornet 4 Drive    21.4   6 110 3.08 19.44  1    3    1
## Hornet Sportabout 18.7   8 175 3.15 17.02  0    3    2

Actually, the logical subsetting is quite powerful. We can use a predicate function, ie., a function delivering a logial state (TRUE or FALSE) within the subsetting:

mtcars[mtcars$cyl == 6, c(1,2)]
##                 mpg cyl
## Mazda RX4      21.0   6
## Mazda RX4 Wag  21.0   6
## Hornet 4 Drive 21.4   6
## Valiant        18.1   6

Here, we declared that we only want rows for which the following condition is TRUE: mtcars$cyl == 6. (And only cols 1 and 2.)

Final words

Subsetting in R is an essential task. It is also not so easy, as many slightly different variants exist. Here, only some ideas were presented. A much broader are excellently presented by Hadley Wickham here.

Besides that subsettting using base R should be well understood, it may be more comfortable to use functions such as select from dplyr.

Downloading a folder (repository) from Github as a whole

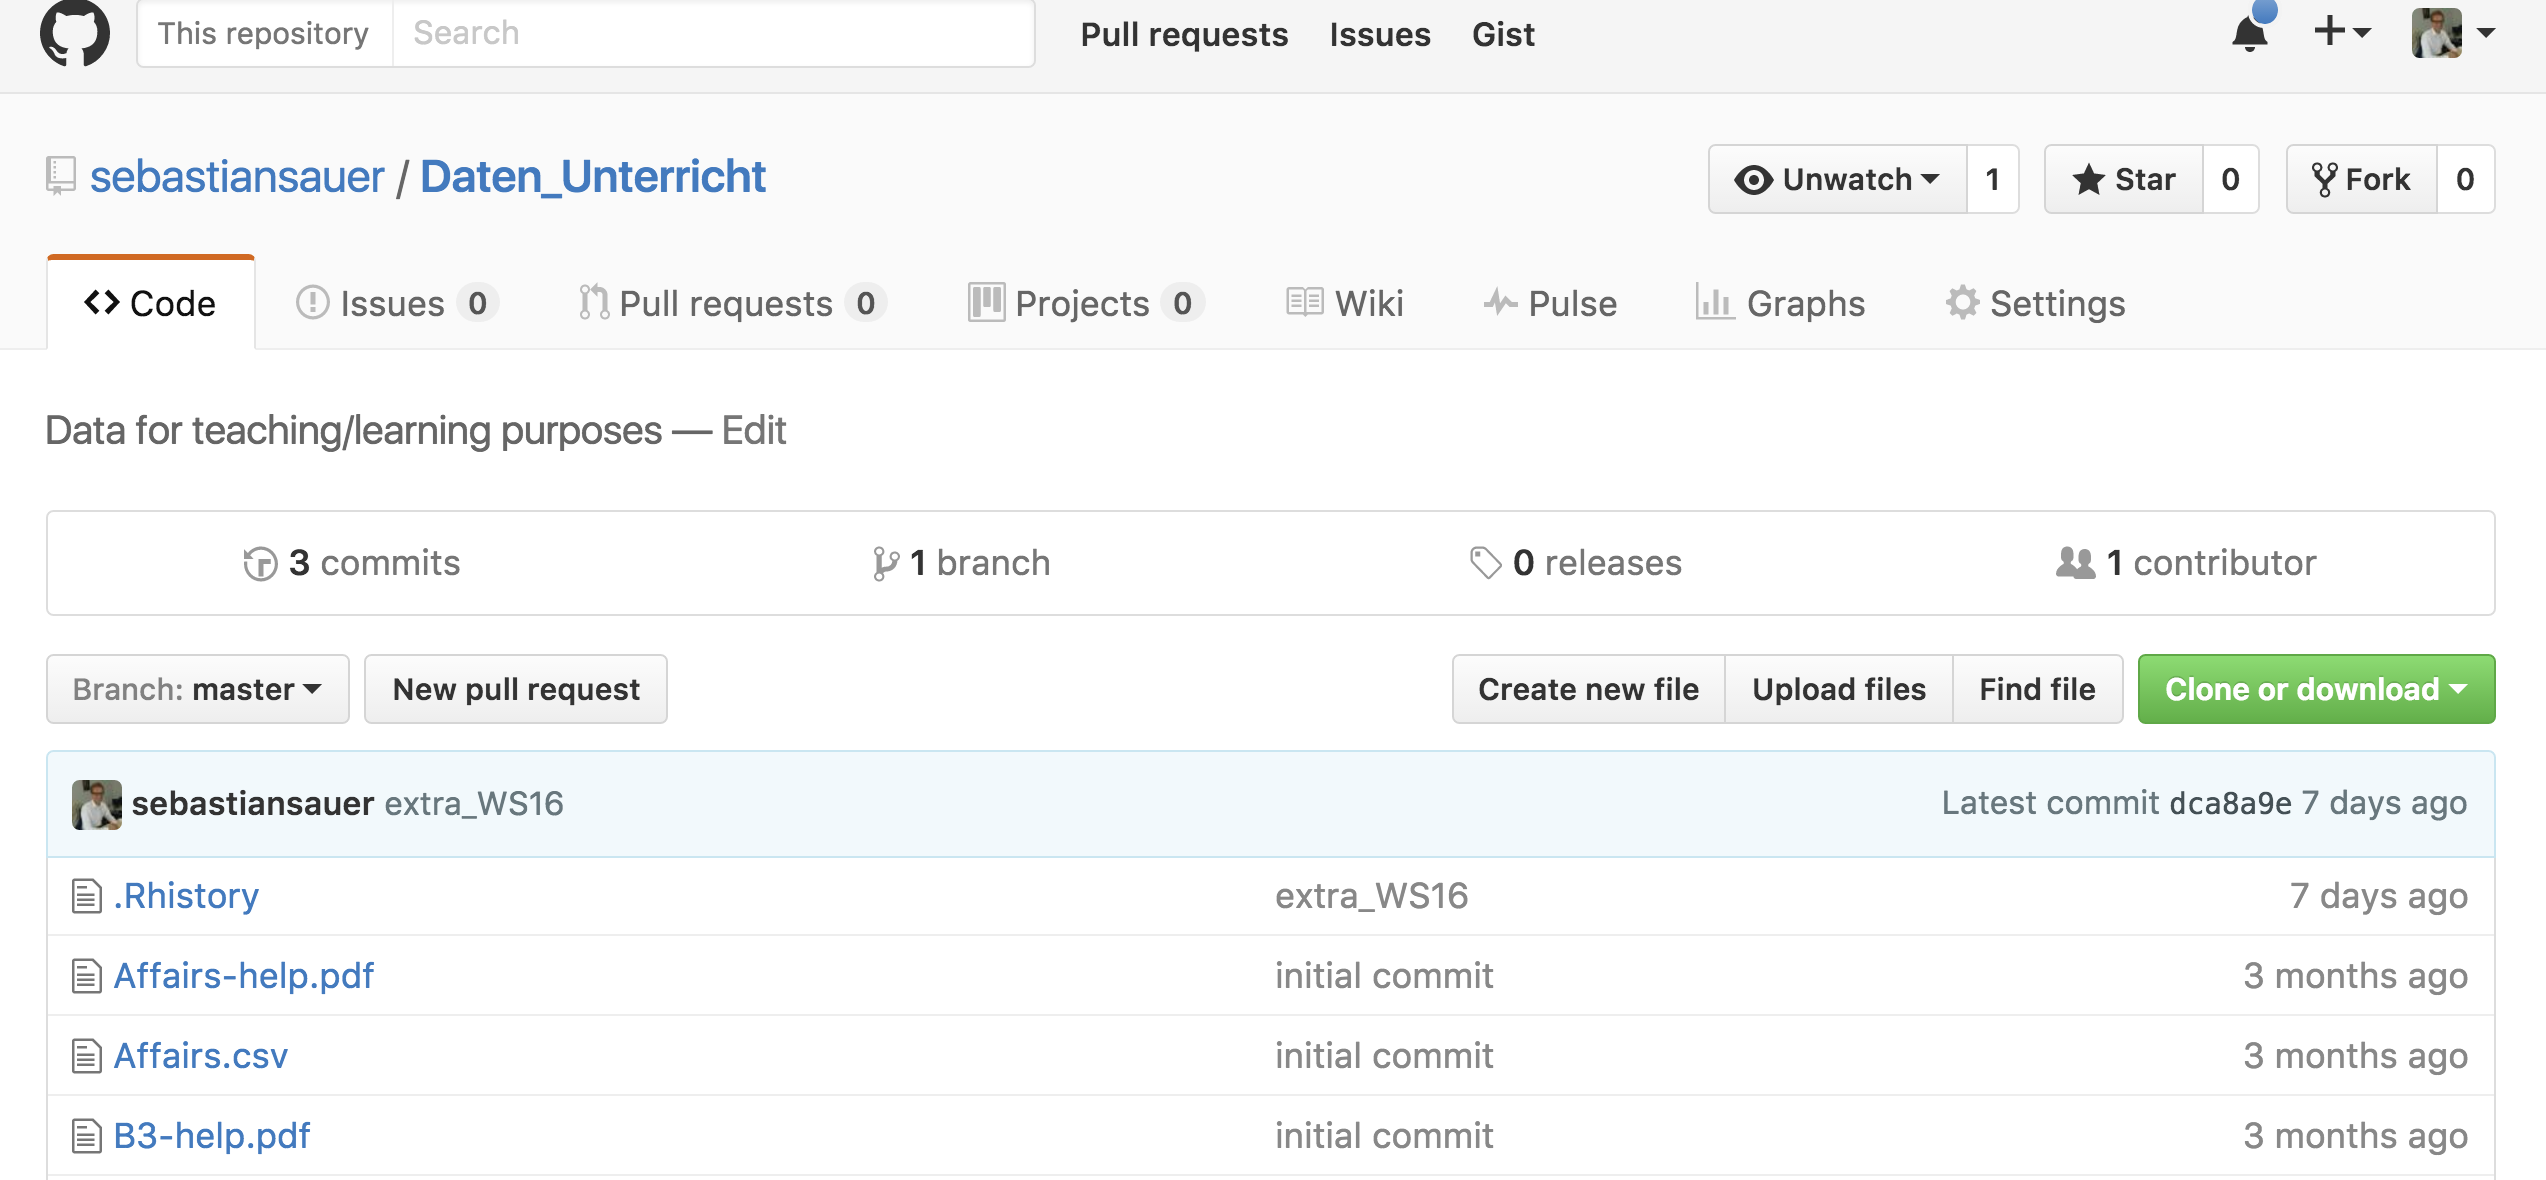
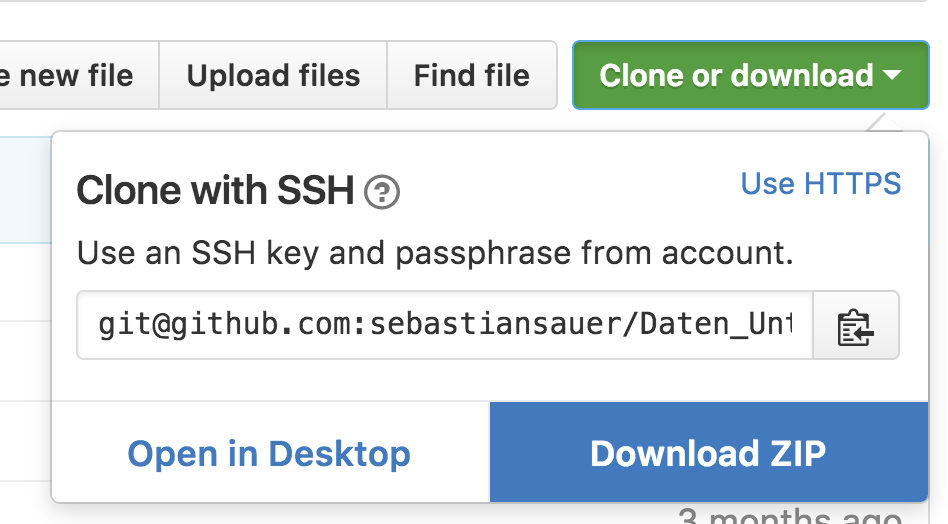
The most direct way to get data from Github to your computer/ into R, is to download the repository. That is, click the big green button:


The big, green button saying “Clone or download”, click it and choose “download zip”.

Of course, for those using Git and Github, it would be appropriate to clone the repository. And, although appearing more advanced, cloning has the definitive advantage that you’ll enjoy the whole of the Github features. In fact, the whole purpose of Github is to provide a history of the file(s), so the purpose is not really served if one just downloads the most recent snapshot. But anyhow, that depends on you own will.

Note that “repository” can be thought of as “folder” or “project”.

Once downloaded, you need to unzip the folder. Unzipping means to “extract” or “unpack” the file/folder. On many machines, this can be accomplished by right clicking the icon and choosing something like “extract here”.

Once extracted, just navigate to the folder and open whatever file you are inclined to.

Downloading individual files from Github

In case you do not want to download the whole repository, individual files can be downloaded and parsed to R quite easily:

library(readr)  # for read_csv
library(knitr)  # for kable
myfile <- "https://raw.github.com/sebastiansauer/Daten_Unterricht/master/Affairs.csv"

Affairs <- read_csv(myfile)
## Warning: Missing column names filled in: 'X1' [1]
## Parsed with column specification:
## cols(
##   X1 = col_integer(),
##   affairs = col_integer(),
##   gender = col_character(),
##   age = col_double(),
##   yearsmarried = col_double(),
##   children = col_character(),
##   religiousness = col_integer(),
##   education = col_integer(),
##   occupation = col_integer(),
##   rating = col_integer()
## )
kable(head(Affairs))
X1 affairs gender age yearsmarried children religiousness education occupation rating
1 0 male 37 10.00 no 3 18 7 4
2 0 female 27 4.00 no 4 14 6 4
3 0 female 32 15.00 yes 1 12 1 4
4 0 male 57 15.00 yes 5 18 6 5
5 0 male 22 0.75 no 2 17 6 3
6 0 female 32 1.50 no 2 17 5 5

Let’s quickly deconstruct the url above from Github. In general, we need to write:

https://raw.github.com/user/repository/branch/file.name.

In many cases, the branch will be “master”. You can easily find out about that one the page of the repo you wanna download:

I’ve noticed that unzipping a repository from Github (and downloading a zip file) can cause confusion, so it might be easier to provide a code bit as shown above.

BTW: read.csv should work equally.

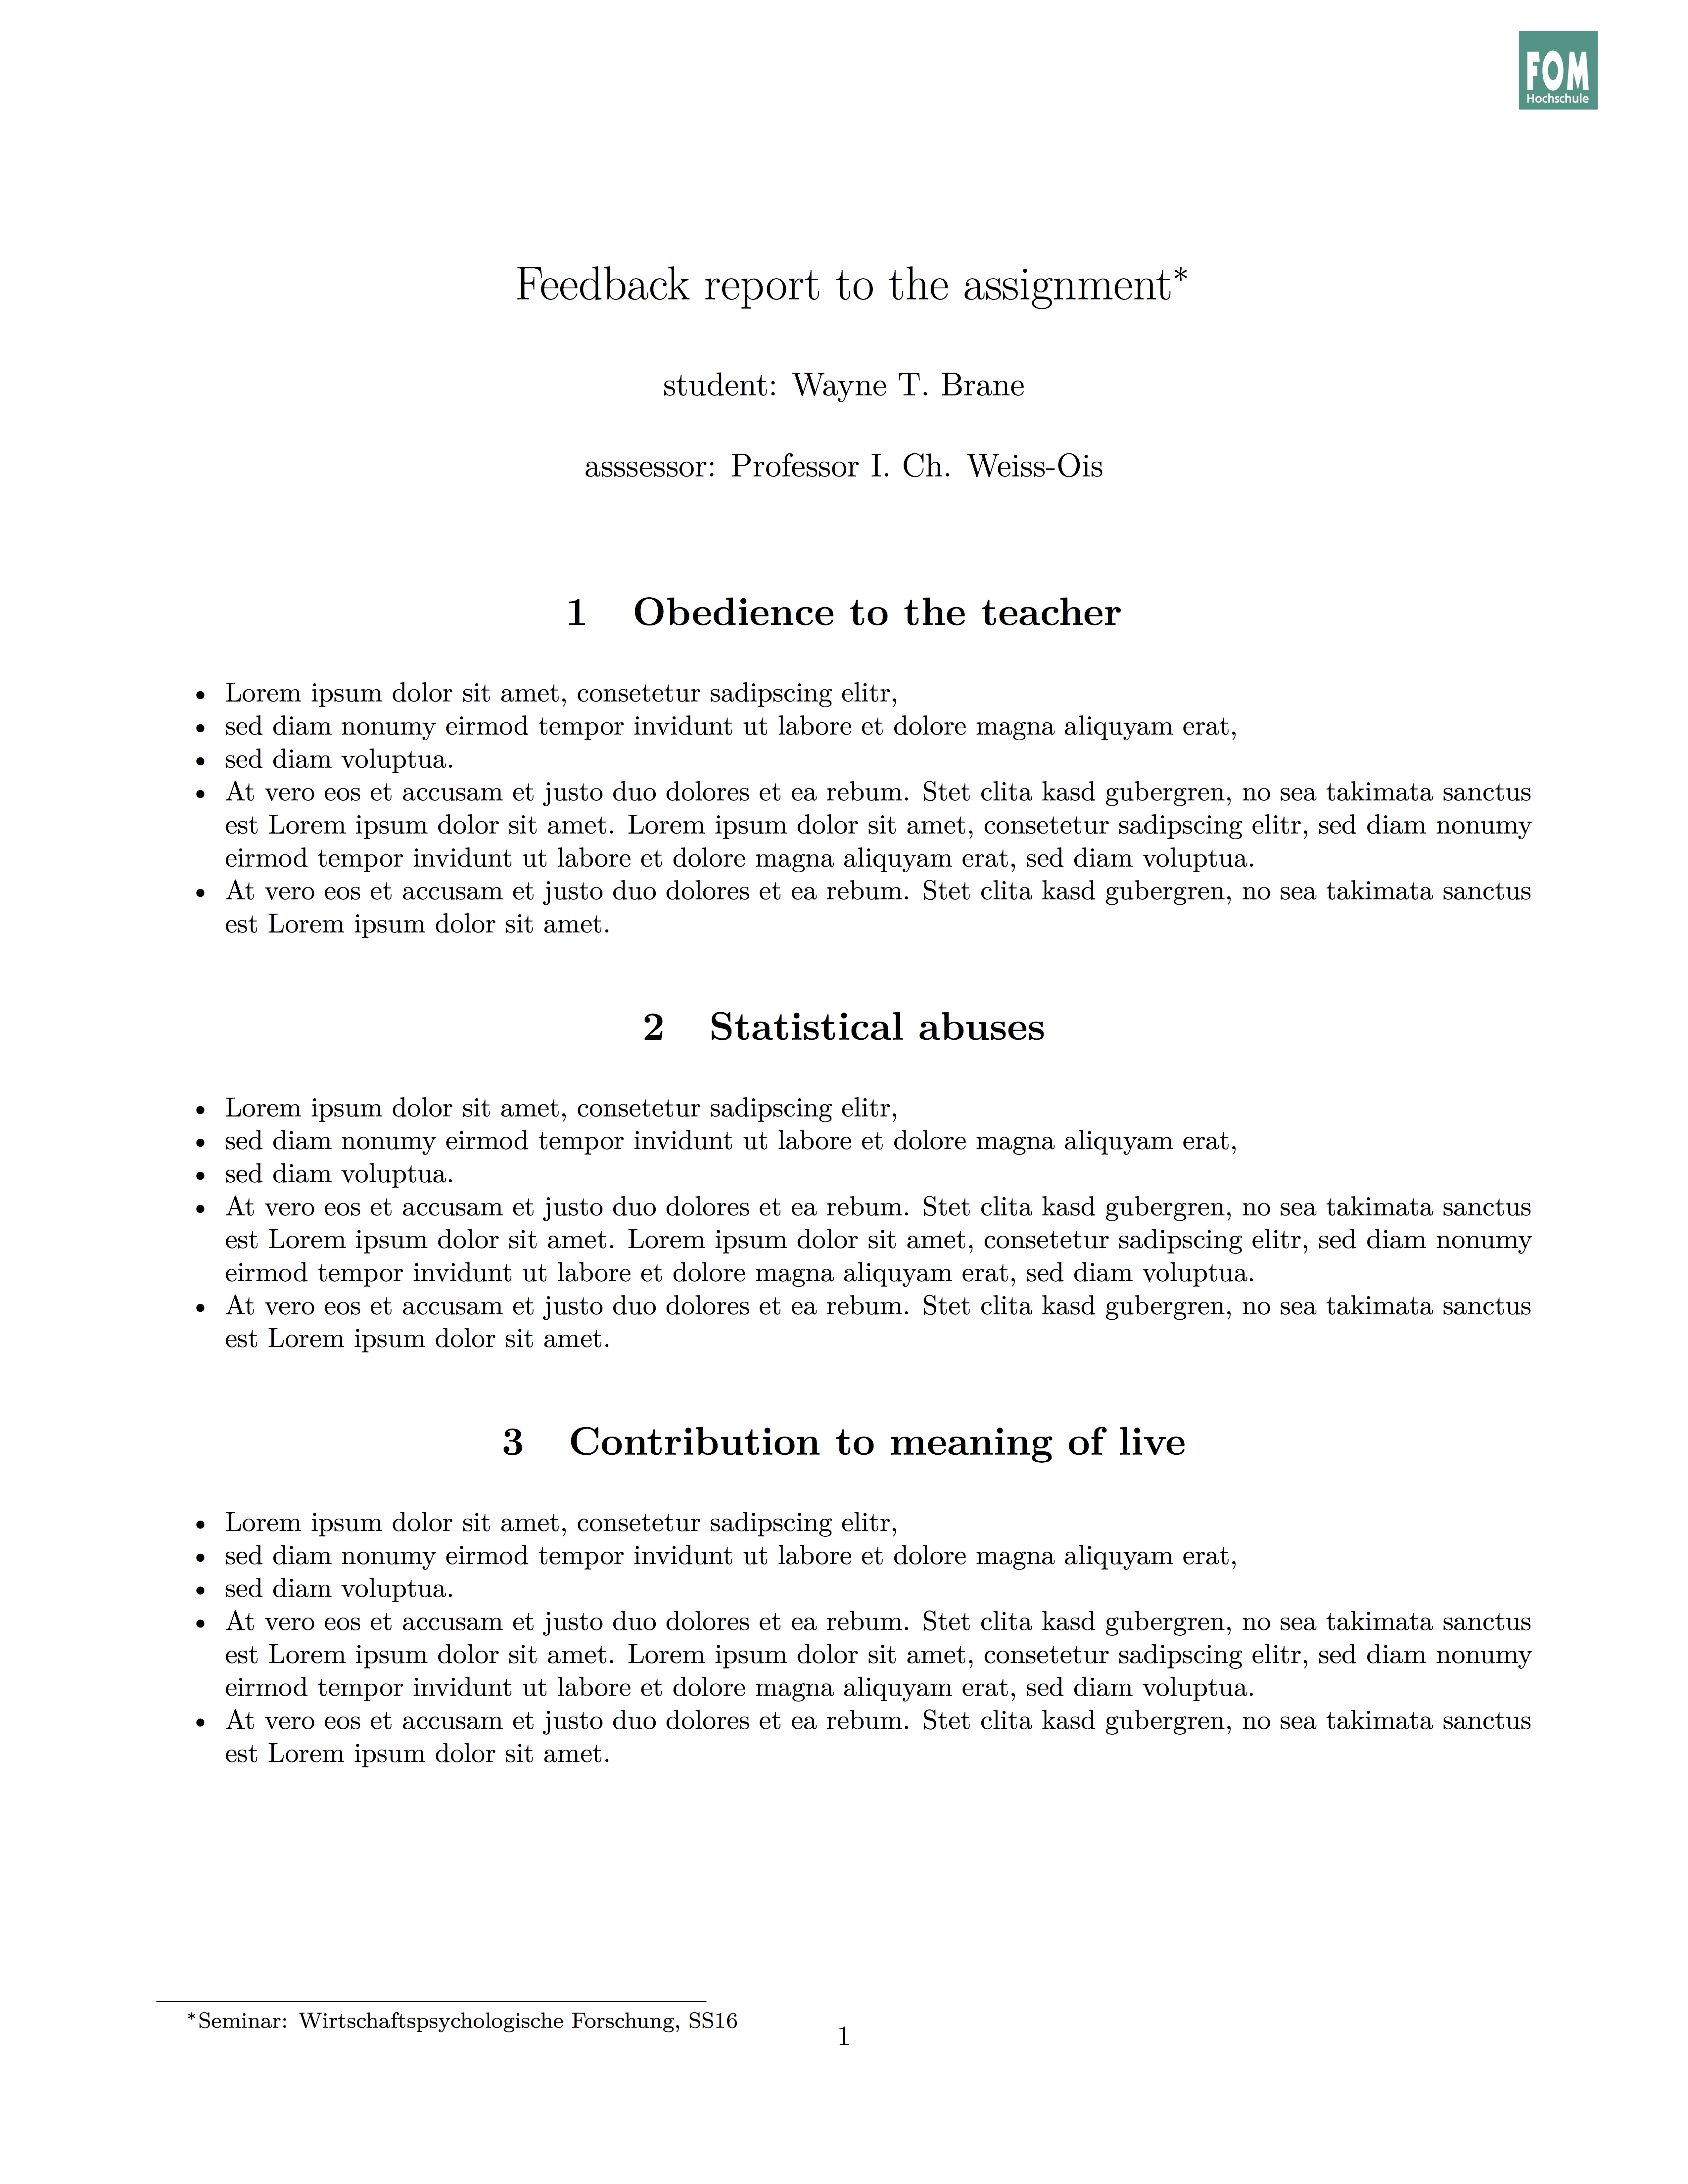
In my role as a teacher, I (have to) write a lot of marking feedback reports. My university provides a website to facilitate the process, that’s great. I have also been writing my reports with Pages, Word, or friends. But somewhat cooler, more attractive, and more reproducible would be using (a markup language such as) Markdown. Basically, that’s easy, but it would be of help to have a template that makes up a nice and nicely formatted report, like this:

Download this pdf file here. Here is the source file. Credit goes to the Pandoc team; I based my template on their’s.

So how to do it?

First and foremorst, write your report using Markdown, and convert it to HTML oder Latex-PDF using Pandoc. Rstudio provides nice introduction, eg., here or here.

Next, tell your Markdown document to use your individual stylesheet, i.e, template. Note that I focus here on PDF output.

---
subtitle: "A general theory ..."
title: "Feedback report to the assignment"
output:
  pdf_document:
    template: template_feedback.latex   
---

You have to put that bit above in the YAML header of your markdown document (right at the top of your document), see the source file for details. And then, you just write your Markdown report in plain English (or whatever language…).

However, where the music actually plays is the latex template, which is being used in the Markdown document (via the YAML header). The idea is that in the Latex file, we define some variables (such as “author” or “title”) which then can be used in the markdown file. Markdown, that is YAML, is able to address those variables defined in the Latex template. In this example, the variables defined include:

  • author
  • title
  • subtitle
  • “thanks to” (I use this field as some “freeride” variable)
  • date

The body (main part) of the onepage example above basically looks like this:


# Obedience to the teacher
- Lorem ipsum dolor sit amet, consetetur sadipscing elitr, 
- sed diam nonumy eirmod tempor invidunt ut labore et dolore magna aliquyam erat, 
- sed diam voluptua. 
...


# Statistical abuses
- Lorem ipsum dolor sit amet, consetetur sadipscing elitr,
...


# Contribution to meaning of live
- Lorem ipsum dolor sit amet, consetetur sadipscing elitr, 
(...)

En plus, the style sheet - being based on Pandoc’s stylesheet - allows for quite a number of more format-based adjustments such as language, geometry of the paper, section-numbering etc. See the excellent Pandoc help for details.

Enjoy!

I just tried to accomplish the following with R: Compute effect sizes for a variable between two groups. Actually, not one numeric variable but many. And compute not only one measure of effect size but several (d, lower/upper CI, CLES,…).

So how to do that?

First, let’s load some data and some (tidyverse and effect size) packages:

knitr::opts_chunk$set(echo = TRUE, cache = FALSE, message = FALSE)
library(purrr)  
library(ggplot2)
library(dplyr)
library(broom)
library(tibble)  

library(compute.es)
data(Fair, package = "Ecdat") # extramarital affairs dataset
glimpse(Fair)
## Observations: 601
## Variables: 9
## $ sex        <fctr> male, female, female, male, male, female, female, ...
## $ age        <dbl> 37, 27, 32, 57, 22, 32, 22, 57, 32, 22, 37, 27, 47,...
## $ ym         <dbl> 10.00, 4.00, 15.00, 15.00, 0.75, 1.50, 0.75, 15.00,...
## $ child      <fctr> no, no, yes, yes, no, no, no, yes, yes, no, yes, y...
## $ religious  <int> 3, 4, 1, 5, 2, 2, 2, 2, 4, 4, 2, 4, 5, 2, 4, 1, 2, ...
## $ education  <dbl> 18, 14, 12, 18, 17, 17, 12, 14, 16, 14, 20, 18, 17,...
## $ occupation <int> 7, 6, 1, 6, 6, 5, 1, 4, 1, 4, 7, 6, 6, 5, 5, 5, 4, ...
## $ rate       <int> 4, 4, 4, 5, 3, 5, 3, 4, 2, 5, 2, 4, 4, 4, 4, 5, 3, ...
## $ nbaffairs  <dbl> 0, 0, 0, 0, 0, 0, 0, 0, 0, 0, 0, 0, 0, 0, 0, 0, 0, ...

Extract the numeric variables:

Fair %>% 
  select_if(is.numeric) %>% names -> Fair_num
Fair_num
## [1] "age"        "ym"         "religious"  "education"  "occupation"
## [6] "rate"       "nbaffairs"

Now suppose we want to compare men and women (people do that all the time). First, we do a t-test for each numeric variable (and save the results):

Fair %>% 
  select(one_of(Fair_num)) %>% 
  map(~t.test(. ~ Fair$sex)) -> Fair_t_test

The resulting variable is a list of t-test-results (each a list again). Let’s have a look at one of the t-test results:

Fair_t_test[[1]]
## 
## 	Welch Two Sample t-test
## 
## data:  . by Fair$sex
## t = -4.7285, df = 575.26, p-value = 2.848e-06
## alternative hypothesis: true difference in means is not equal to 0
## 95 percent confidence interval:
##  -5.014417 -2.071219
## sample estimates:
## mean in group female   mean in group male 
##             30.80159             34.34441

That’s the structure of a t-test result object (one element of Fair_t_test ):

str(Fair_t_test[[1]])
## List of 9
##  $ statistic  : Named num -4.73
##   ..- attr(*, "names")= chr "t"
##  $ parameter  : Named num 575
##   ..- attr(*, "names")= chr "df"
##  $ p.value    : num 2.85e-06
##  $ conf.int   : atomic [1:2] -5.01 -2.07
##   ..- attr(*, "conf.level")= num 0.95
##  $ estimate   : Named num [1:2] 30.8 34.3
##   ..- attr(*, "names")= chr [1:2] "mean in group female" "mean in group male"
##  $ null.value : Named num 0
##   ..- attr(*, "names")= chr "difference in means"
##  $ alternative: chr "two.sided"
##  $ method     : chr "Welch Two Sample t-test"
##  $ data.name  : chr ". by Fair$sex"
##  - attr(*, "class")= chr "htest"

So we see that t-value itself can be accessed with eg., Fair_t_test[[1]]$statistic. The t-value is now fed into a function that computes effect sizes.

Fair_t_test %>% 
  map(~tes(.$statistic,
          n.1 = nrow(filter(Fair, sex == "female")),
          n.2 = nrow(filter(Fair, sex == "male")))) -> Fair_effsize
## Mean Differences ES: 
##  
##  d [ 95 %CI] = -0.39 [ -0.55 , -0.22 ] 
##   var(d) = 0.01 
##   p-value(d) = 0 
##   U3(d) = 34.97 % 
##   CLES(d) = 39.24 % 
##   Cliff's Delta = -0.22 
##  
##  g [ 95 %CI] = -0.39 [ -0.55 , -0.22 ] 
##   var(g) = 0.01 
##   p-value(g) = 0 
##   U3(g) = 34.99 % 
##   CLES(g) = 39.25 % 
##  
##  Correlation ES: 
##  
##  r [ 95 %CI] = 0.19 [ 0.11 , 0.27 ] 
##   var(r) = 0 
##   p-value(r) = 0 
##  
##  z [ 95 %CI] = 0.19 [ 0.11 , 0.27 ] 
##   var(z) = 0 
##   p-value(z) = 0 
##  
##  Odds Ratio ES: 
##  
##  OR [ 95 %CI] = 0.5 [ 0.37 , 0.67 ] 
##   p-value(OR) = 0 
##  
##  Log OR [ 95 %CI] = -0.7 [ -0.99 , -0.41 ] 
##   var(lOR) = 0.02 
##   p-value(Log OR) = 0 
##  
##  Other: 
##  
##  NNT = -11.08 
##  Total N = 601Mean Differences ES: 
##  
##  d [ 95 %CI] = -0.06 [ -0.22 , 0.1 ] 
##   var(d) = 0.01 
##   p-value(d) = 0.46 
##   U3(d) = 47.58 % 
##   CLES(d) = 48.29 % 
##   Cliff's Delta = -0.03 
##  
##  g [ 95 %CI] = -0.06 [ -0.22 , 0.1 ] 
##   var(g) = 0.01 
##   p-value(g) = 0.46 
##   U3(g) = 47.59 % 
##   CLES(g) = 48.29 % 
##  
##  Correlation ES: 
##  
##  r [ 95 %CI] = 0.03 [ -0.05 , 0.11 ] 
##   var(r) = 0 
##   p-value(r) = 0.46 
##  
##  z [ 95 %CI] = 0.03 [ -0.05 , 0.11 ] 
##   var(z) = 0 
##   p-value(z) = 0.46 
##  
##  Odds Ratio ES: 
##  
##  OR [ 95 %CI] = 0.9 [ 0.67 , 1.2 ] 
##   p-value(OR) = 0.46 
##  
##  Log OR [ 95 %CI] = -0.11 [ -0.4 , 0.18 ] 
##   var(lOR) = 0.02 
##   p-value(Log OR) = 0.46 
##  
##  Other: 
##  
##  NNT = -60.47 
##  Total N = 601Mean Differences ES: 
##  
##  d [ 95 %CI] = -0.02 [ -0.18 , 0.15 ] 
##   var(d) = 0.01 
##   p-value(d) = 0.85 
##   U3(d) = 49.39 % 
##   CLES(d) = 49.57 % 
##   Cliff's Delta = -0.01 
##  
##  g [ 95 %CI] = -0.02 [ -0.18 , 0.14 ] 
##   var(g) = 0.01 
##   p-value(g) = 0.85 
##   U3(g) = 49.39 % 
##   CLES(g) = 49.57 % 
##  
##  Correlation ES: 
##  
##  r [ 95 %CI] = 0.01 [ -0.07 , 0.09 ] 
##   var(r) = 0 
##   p-value(r) = 0.85 
##  
##  z [ 95 %CI] = 0.01 [ -0.07 , 0.09 ] 
##   var(z) = 0 
##   p-value(z) = 0.85 
##  
##  Odds Ratio ES: 
##  
##  OR [ 95 %CI] = 0.97 [ 0.73 , 1.3 ] 
##   p-value(OR) = 0.85 
##  
##  Log OR [ 95 %CI] = -0.03 [ -0.32 , 0.26 ] 
##   var(lOR) = 0.02 
##   p-value(Log OR) = 0.85 
##  
##  Other: 
##  
##  NNT = -234.86 
##  Total N = 601Mean Differences ES: 
##  
##  d [ 95 %CI] = -0.86 [ -1.03 , -0.69 ] 
##   var(d) = 0.01 
##   p-value(d) = 0 
##   U3(d) = 19.52 % 
##   CLES(d) = 27.18 % 
##   Cliff's Delta = -0.46 
##  
##  g [ 95 %CI] = -0.86 [ -1.03 , -0.69 ] 
##   var(g) = 0.01 
##   p-value(g) = 0 
##   U3(g) = 19.54 % 
##   CLES(g) = 27.2 % 
##  
##  Correlation ES: 
##  
##  r [ 95 %CI] = 0.39 [ 0.32 , 0.46 ] 
##   var(r) = 0 
##   p-value(r) = 0 
##  
##  z [ 95 %CI] = 0.42 [ 0.34 , 0.5 ] 
##   var(z) = 0 
##   p-value(z) = 0 
##  
##  Odds Ratio ES: 
##  
##  OR [ 95 %CI] = 0.21 [ 0.16 , 0.29 ] 
##   p-value(OR) = 0 
##  
##  Log OR [ 95 %CI] = -1.56 [ -1.86 , -1.25 ] 
##   var(lOR) = 0.02 
##   p-value(Log OR) = 0 
##  
##  Other: 
##  
##  NNT = -6.43 
##  Total N = 601Mean Differences ES: 
##  
##  d [ 95 %CI] = -1.08 [ -1.25 , -0.91 ] 
##   var(d) = 0.01 
##   p-value(d) = 0 
##   U3(d) = 13.95 % 
##   CLES(d) = 22.2 % 
##   Cliff's Delta = -0.56 
##  
##  g [ 95 %CI] = -1.08 [ -1.25 , -0.91 ] 
##   var(g) = 0.01 
##   p-value(g) = 0 
##   U3(g) = 13.98 % 
##   CLES(g) = 22.22 % 
##  
##  Correlation ES: 
##  
##  r [ 95 %CI] = 0.48 [ 0.41 , 0.54 ] 
##   var(r) = 0 
##   p-value(r) = 0 
##  
##  z [ 95 %CI] = 0.52 [ 0.44 , 0.6 ] 
##   var(z) = 0 
##   p-value(z) = 0 
##  
##  Odds Ratio ES: 
##  
##  OR [ 95 %CI] = 0.14 [ 0.1 , 0.19 ] 
##   p-value(OR) = 0 
##  
##  Log OR [ 95 %CI] = -1.96 [ -2.28 , -1.65 ] 
##   var(lOR) = 0.03 
##   p-value(Log OR) = 0 
##  
##  Other: 
##  
##  NNT = -5.79 
##  Total N = 601Mean Differences ES: 
##  
##  d [ 95 %CI] = 0.02 [ -0.15 , 0.18 ] 
##   var(d) = 0.01 
##   p-value(d) = 0.85 
##   U3(d) = 50.6 % 
##   CLES(d) = 50.43 % 
##   Cliff's Delta = 0.01 
##  
##  g [ 95 %CI] = 0.02 [ -0.15 , 0.18 ] 
##   var(g) = 0.01 
##   p-value(g) = 0.85 
##   U3(g) = 50.6 % 
##   CLES(g) = 50.43 % 
##  
##  Correlation ES: 
##  
##  r [ 95 %CI] = 0.01 [ -0.07 , 0.09 ] 
##   var(r) = 0 
##   p-value(r) = 0.85 
##  
##  z [ 95 %CI] = 0.01 [ -0.07 , 0.09 ] 
##   var(z) = 0 
##   p-value(z) = 0.85 
##  
##  Odds Ratio ES: 
##  
##  OR [ 95 %CI] = 1.03 [ 0.77 , 1.37 ] 
##   p-value(OR) = 0.85 
##  
##  Log OR [ 95 %CI] = 0.03 [ -0.26 , 0.32 ] 
##   var(lOR) = 0.02 
##   p-value(Log OR) = 0.85 
##  
##  Other: 
##  
##  NNT = 235.02 
##  Total N = 601Mean Differences ES: 
##  
##  d [ 95 %CI] = -0.02 [ -0.18 , 0.14 ] 
##   var(d) = 0.01 
##   p-value(d) = 0.77 
##   U3(d) = 49.06 % 
##   CLES(d) = 49.34 % 
##   Cliff's Delta = -0.01 
##  
##  g [ 95 %CI] = -0.02 [ -0.18 , 0.14 ] 
##   var(g) = 0.01 
##   p-value(g) = 0.77 
##   U3(g) = 49.07 % 
##   CLES(g) = 49.34 % 
##  
##  Correlation ES: 
##  
##  r [ 95 %CI] = 0.01 [ -0.07 , 0.09 ] 
##   var(r) = 0 
##   p-value(r) = 0.77 
##  
##  z [ 95 %CI] = 0.01 [ -0.07 , 0.09 ] 
##   var(z) = 0 
##   p-value(z) = 0.77 
##  
##  Odds Ratio ES: 
##  
##  OR [ 95 %CI] = 0.96 [ 0.72 , 1.28 ] 
##   p-value(OR) = 0.77 
##  
##  Log OR [ 95 %CI] = -0.04 [ -0.33 , 0.25 ] 
##   var(lOR) = 0.02 
##   p-value(Log OR) = 0.77 
##  
##  Other: 
##  
##  NNT = -153.72 
##  Total N = 601

The resulting object (Fair_effsize) is a list where each list element is the output of the tes function. Let’s have a look at one of these list elements:

Fair_effsize[[1]]
##   N.total n.1 n.2     d var.d   l.d   u.d  U3.d  cl.d cliffs.d pval.d
## t     601 315 286 -0.39  0.01 -0.55 -0.22 34.97 39.24    -0.22      0
##       g var.g   l.g   u.g  U3.g  cl.g pval.g    r var.r  l.r  u.r pval.r
## t -0.39  0.01 -0.55 -0.22 34.99 39.25      0 0.19     0 0.11 0.27      0
##   fisher.z var.z  l.z  u.z  OR l.or u.or pval.or  lOR l.lor u.lor pval.lor
## t     0.19     0 0.11 0.27 0.5 0.37 0.67       0 -0.7 -0.99 -0.41        0
##      NNT
## t -11.08
str(Fair_effsize[[1]])
## 'data.frame':	1 obs. of  36 variables:
##  $ N.total : num 601
##  $ n.1     : num 315
##  $ n.2     : num 286
##  $ d       : num -0.39
##  $ var.d   : num 0.01
##  $ l.d     : num -0.55
##  $ u.d     : num -0.22
##  $ U3.d    : num 35
##  $ cl.d    : num 39.2
##  $ cliffs.d: num -0.22
##  $ pval.d  : num 0
##  $ g       : num -0.39
##  $ var.g   : num 0.01
##  $ l.g     : num -0.55
##  $ u.g     : num -0.22
##  $ U3.g    : num 35
##  $ cl.g    : num 39.2
##  $ pval.g  : num 0
##  $ r       : num 0.19
##  $ var.r   : num 0
##  $ l.r     : num 0.11
##  $ u.r     : num 0.27
##  $ pval.r  : num 0
##  $ fisher.z: num 0.19
##  $ var.z   : num 0
##  $ l.z     : num 0.11
##  $ u.z     : num 0.27
##  $ OR      : num 0.5
##  $ l.or    : num 0.37
##  $ u.or    : num 0.67
##  $ pval.or : num 0
##  $ lOR     : num -0.7
##  $ l.lor   : num -0.99
##  $ u.lor   : num -0.41
##  $ pval.lor: num 0
##  $ NNT     : num -11.1

The element itself is a data frame with n=1 and p=36. So we could nicely row-bind these 36 rows into one data frame. How to do that?

Fair_effsize %>% 
  map( ~do.call(rbind, .)) %>% 
  as.data.frame -> Fair_effsize_df

head(Fair_effsize_df)
##            age     ym religious education occupation   rate nbaffairs
## N.total 601.00 601.00    601.00    601.00     601.00 601.00    601.00
## n.1     315.00 315.00    315.00    315.00     315.00 315.00    315.00
## n.2     286.00 286.00    286.00    286.00     286.00 286.00    286.00
## d        -0.39  -0.06     -0.02     -0.86      -1.08   0.02     -0.02
## var.d     0.01   0.01      0.01      0.01       0.01   0.01      0.01
## l.d      -0.55  -0.22     -0.18     -1.03      -1.25  -0.15     -0.18

What we did here is:

  1. Take each list element and then… (that was map)
  2. bind these elements row-wise together, ie,. “underneath” each other (rbind). do.call is only a helper that allows to hand over to rbind a bunch of rows.
  3. Then convert this element, still a list, to a data frame (not much changes in effect)

Finally, let’s convert the row names to a column:

Fair_effsize_df %>% 
  rownames_to_column -> Fair_effsize_df

head(Fair_effsize_df)
##   rowname    age     ym religious education occupation   rate nbaffairs
## 1 N.total 601.00 601.00    601.00    601.00     601.00 601.00    601.00
## 2     n.1 315.00 315.00    315.00    315.00     315.00 315.00    315.00
## 3     n.2 286.00 286.00    286.00    286.00     286.00 286.00    286.00
## 4       d  -0.39  -0.06     -0.02     -0.86      -1.08   0.02     -0.02
## 5   var.d   0.01   0.01      0.01      0.01       0.01   0.01      0.01
## 6     l.d  -0.55  -0.22     -0.18     -1.03      -1.25  -0.15     -0.18

A bit of a ride, but we got there!

And I am sure, better ways are out there. Let me know!