What is “data cleansing” about?
Data analysis, in practice, consists typically of some different steps which can be subsumed as “preparing data” and “model data” (not considering communication here):
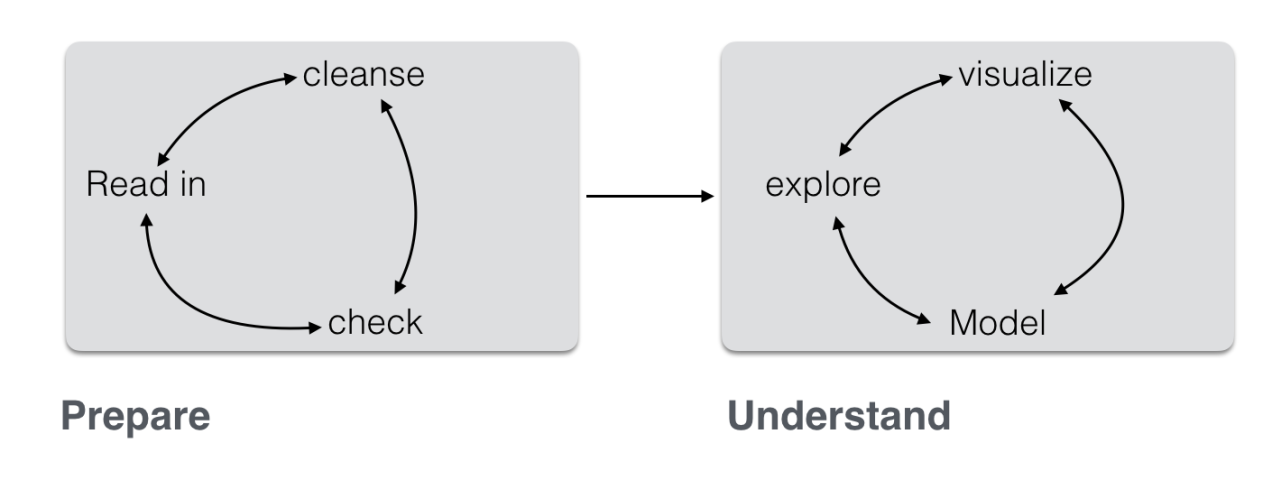
(Inspired by this)
Often, the first major part — “prepare” — is the most time consuming. This can be lamented since many analysts prefer the cool modeling aspects (since I want to show my math!). In practice, one rather has to get his (her) hands dirt…
In this post, I want to put together some kind of checklist of frequent steps in data preparation. More precisely, I would like to detail some typical steps in “cleansing” your data. Such steps include:
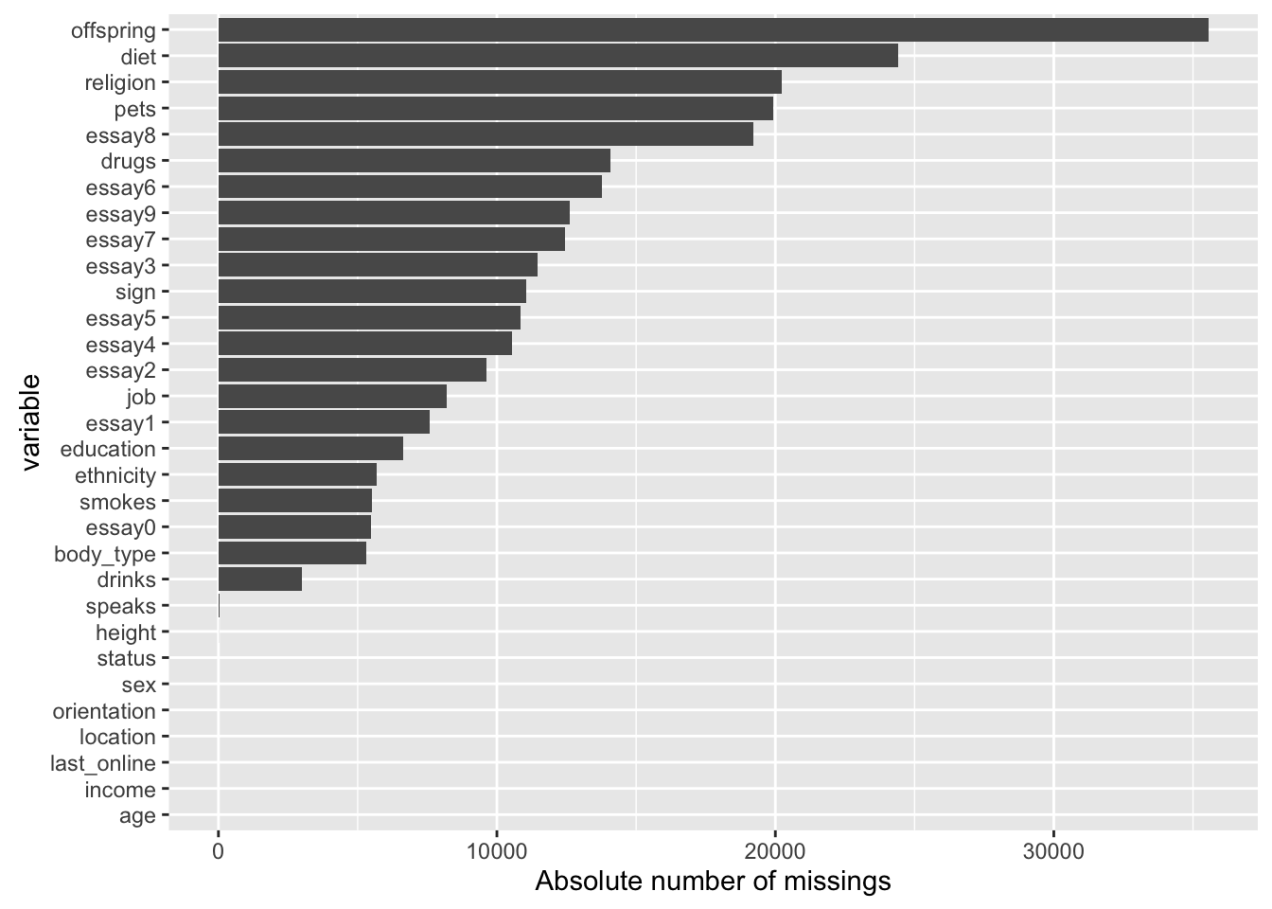
- identify missings
- identify outliers
- check for overall plausibility and errors (e.g, typos)
- identify highly correlated variables
- identify variables with (nearly) no variance
- identify variables with strange names or values
- check variable classes (eg. characters vs factors)
- remove/transform some variables (maybe your model does not like categorial variables)
- rename some variables or values (especially interesting if large number)
- check some overall pattern (statistical/ numerical summaries)
- center/scale variables
You can read the full post including source code here (Github). Here is an output file (html).
Example: Analyse missing values