Shading values/areas under the normal curve is a quite frequent taks in eg educational contexts. Thanks to Hadley in this post, I found this easy solution.
library(ggplot2)
```r
ggplot(NULL, aes(c(-3,3))) +
  geom_area(stat = "function", fun = dnorm, fill = "#00998a", xlim = c(-3, 0)) +
  geom_area(stat = "function", fun = dnorm, fill = "grey80", xlim = c(0, 3))
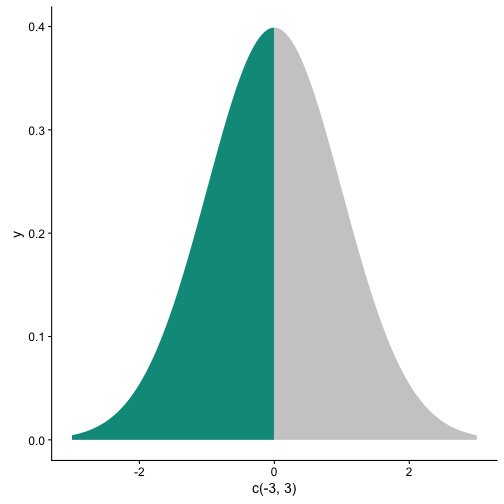
Simple, right?
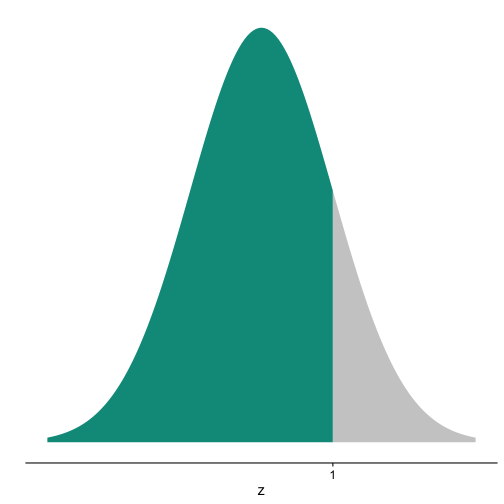
Some minor beautification:
 ggplot(NULL, aes(c(-3,3))) +
  geom_area(stat = "function", fun = dnorm, fill = "#00998a", xlim = c(-3, 1)) +
  geom_area(stat = "function", fun = dnorm, fill = "grey80", xlim = c(1, 3)) +
  labs(x = "z", y = "") +
  scale_y_continuous(breaks = NULL) +
  scale_x_continuous(breaks = 1)
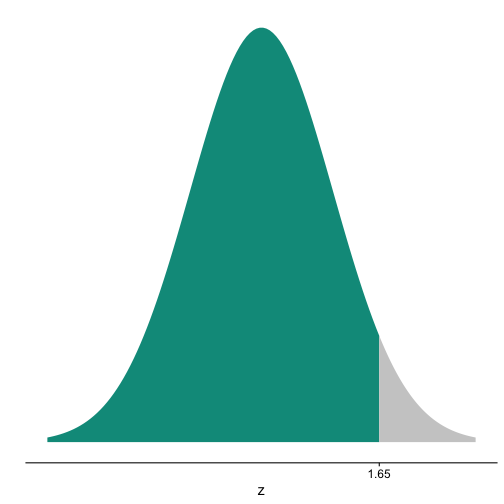
And some other quantiles:
ggplot(NULL, aes(c(-3,3))) +
  geom_area(stat = "function", fun = dnorm, fill = "#00998a", xlim = c(-3, 1.65)) +
  geom_area(stat = "function", fun = dnorm, fill = "grey80", xlim = c(1.65, 3)) +
  labs(x = "z", y = "") +
  scale_y_continuous(breaks = NULL) +
  scale_x_continuous(breaks = 1.65)
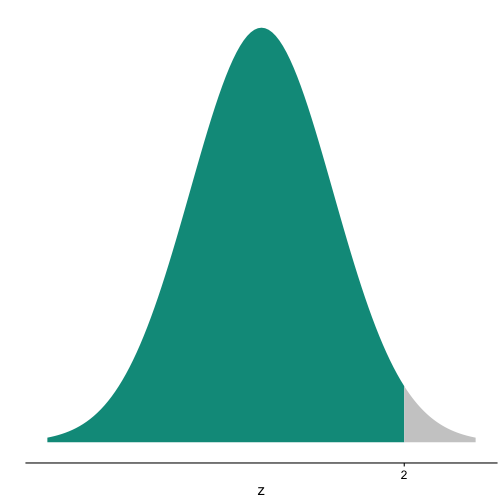
ggplot(NULL, aes(c(-3,3))) +
  geom_area(stat = "function", fun = dnorm, fill = "#00998a", xlim = c(-3, 2)) +
  geom_area(stat = "function", fun = dnorm, fill = "grey80", xlim = c(2, 3)) +
  labs(x = "z", y = "") +
  scale_y_continuous(breaks = NULL) +
  scale_x_continuous(breaks = 2)