An old story is that one of the farmer with a fence of some given length, say 20m. Now this farmer wants to put up his fence so that he claims the largest piece of land possible. What width (w) and height (h) should we pick?
Instead of a formal proof, let’s start with a visualization.
First, we need some packages.
library(tidyverse)
library(gganimate)
library(RColorBrewer)
library(scales)
library(knitr)
Now, let’s make up serveral ways to split up a rectengular piece of land. Note that we only need to define two sides (width and height), as the circumference of a rectangle is \(c = 2w + sh\).
df <- data_frame(
  w = c(0:10, 9:0),
  h = c(10:0, 1:10),
  area = w * h)

df$row <- 1:nrow(df)
Next, let’s define a palette from Brewer’s palette no 5.
cols <- brewer_pal("seq")(5)
mypal <- gradient_n_pal(cols)(seq(0, 1, length.out = 21))

names(mypal) <- as.character(df$area)
Next, plot an animated diagram:
p <- ggplot(df) +
  aes(x = w, y = h, fill = mypal, frame = row) +
  geom_rect(aes(xmax = w, ymax = h), xmin = 0, ymin = 0) +
  labs(title = paste0("area = ", df$area)) +
  # theme(legend.position = "none") +
  guides(fill = FALSE) +
  theme(plot.title = element_text(hjust = 0.5))

gganimate(p)
detach("package:gganimate", unload=TRUE)
Save output as gif:
#gganimate(p, "output.gif")
We can see (those wich quick eyes) that area is maximized when our piece of land is of quadratic shape. Glimpsing at the numbers confirms that impression:
df %>%
  select(row, w, h, area) %>%
  kable
| row | w | h | area |
|---|---|---|---|
| 1 | 0 | 10 | 0 |
| 2 | 1 | 9 | 9 |
| 3 | 2 | 8 | 16 |
| 4 | 3 | 7 | 21 |
| 5 | 4 | 6 | 24 |
| 6 | 5 | 5 | 25 |
| 7 | 6 | 4 | 24 |
| 8 | 7 | 3 | 21 |
| 9 | 8 | 2 | 16 |
| 10 | 9 | 1 | 9 |
| 11 | 10 | 0 | 0 |
| 12 | 9 | 1 | 9 |
| 13 | 8 | 2 | 16 |
| 14 | 7 | 3 | 21 |
| 15 | 6 | 4 | 24 |
| 16 | 5 | 5 | 25 |
| 17 | 4 | 6 | 24 |
| 18 | 3 | 7 | 21 |
| 19 | 2 | 8 | 16 |
| 20 | 1 | 9 | 9 |
| 21 | 0 | 10 | 0 |
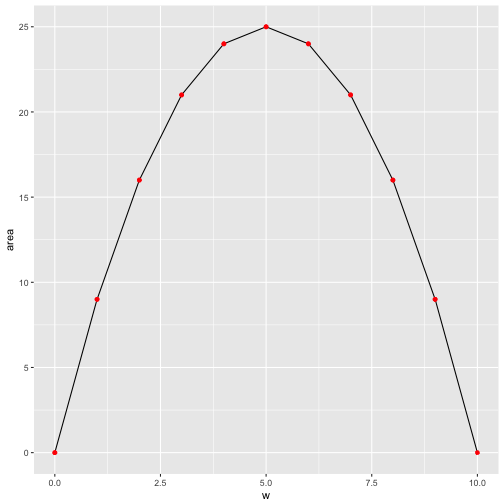
Area as a function of w
Maybe a more classical plot of area as a function of w (or h) is in order.
ggplot(df) +
  aes(y = area) +
  geom_line(aes(x = w)) +
  geom_point(aes(x = w), color = "red")
Similarly, area as a function of h:
ggplot(df) +
  aes(y = area) +
  geom_line(aes(x = h)) +
  geom_point(aes(x = h), color = "red")

That’s of coure no formal proof, but we get a “feel” that quadratic forms make best use of the fence (ie maximize the area for a given circumference) for all rectangular forms.
Proof
More formally, note that \(2w + 2h = 20\), or \(w+h=10\).
The area \(a\) is given by
\(a = wh = w(10-w) = 10w - w^2\).
The derivative of this function is zero at the maximum, so
\(\frac{da}{dw} = 10 - 2w\).
This equation is satisfied when \(a = 5\), hence also \(b = 5\). So the maximum rectengular area enclosed by a 20 meter fence is provided by a side length of 5 meters. a