---
title: rquadrat
date: '2026-07-14'
categories:
- paper
- todo
---

<!-- This exercise is authored by Karsten Lübke. -->


```{r libs, include = FALSE}
library(mosaic)
library(exams)
```


```{r data generation, echo = FALSE, results = "hide"}
# Random Data

n <- sample(100 * 1:4, 2)
r <- sample(c(0, sqrt(0.3), sqrt(0.7), sqrt(0.99)), 2)
if (runif(1) < 0.5) r[1] <- -r[1]
if (runif(1) < 0.5) r[2] <- -r[2]
mx <- sample(5 * -3:3, 2)
my <- sample(5 * -3:3, 2)
sx <- sample(c(1, 5, 10), 2)
sy <- sample(c(1, 5, 10), 2)
b <- r * sy/sx
a <- my - b*mx

xA <- rnorm(n[1], mx[1], sx[1])
xB <- rnorm(n[2], mx[2], sx[2])

yA <- b[1] * xA + rnorm(n[1], a[1], sy[1] * sqrt(1- r[1]^2))
yB <- b[2] * xB + rnorm(n[2], a[2], sy[2] * sqrt(1- r[2]^2))

pA <- gf_point(yA ~ xA) %>%
  gf_labs(title = "A", x = "x", y = "y") %>%
  gf_lm()
pB <- gf_point(yB ~ xB) %>%
  gf_labs(title = "B", x = "x", y = "y") %>%
  gf_lm()

## Questions
questions <- character(3)
questions[1] <- "$R^2_A < R^2_B$"
questions[2] <- "$R^2_A \\approx R^2_B$"
questions[3] <- "$R^2_A > R^2_B$"

solutions <- rep(FALSE, 3)
ifelse((r[1]^2 > r[2]^2), solutions[3] <- TRUE, solutions[1] <- TRUE)
```


Question
========

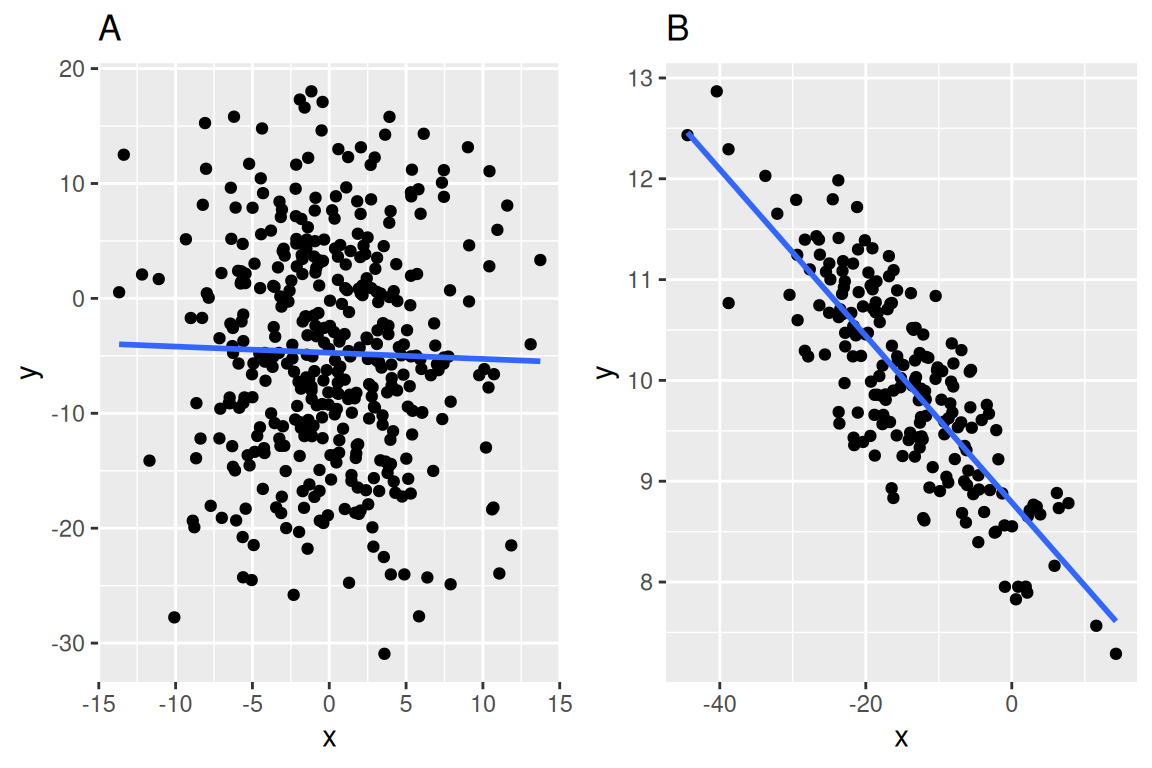
Die beiden folgenden Abbildungen zeigen zwei lineare Regressionen.

```{r show-plot, echo = FALSE, results="hide", fig.height = 4, fig.width = 6, fig.cap = ""}
gridExtra::grid.arrange(pA,pB, nrow=1)
```

Welche Aussage stimmt?

```{r questionlist, echo = FALSE, results = "asis"}
answerlist(questions, markup = "markdown")
```

Solution
========

Je enger die Punkte um die Gerade streuen, desto größer ist $R^2$.


Aufgabenname: `rquadrat`


```{r solutionlist, echo = FALSE, results = "asis"}
answerlist(ifelse(solutions, "Richtig", "Falsch"), markup = "markdown")
```

Meta-information
================
extype: schoice
expoints: 1
exsolution: `r exams::mchoice2string(solutions, single = TRUE)`
exname: rquadrat