library(tidyverse)ggstatsplot01
Question
Erstellen Sie ein Diagramm zum Vergleich von Gruppen für eine metrische AV. Nutzen Sie das R-Paket ggstatsplot und den Datensatz mtcars.
Forschungsfrage: Unterscheidet sich die PS-Zahl von Autos in Abhängigkeit der Zylinderzahl?
Gruppierunsvariable (UV): Anzahl der Zylinder Outcomevariable (AV): PS-Zahl
Solution
library(tidyverse)
library(ggstatsplot)ggbetweenstats(
data = mtcars,
x = cyl,
y = hp
)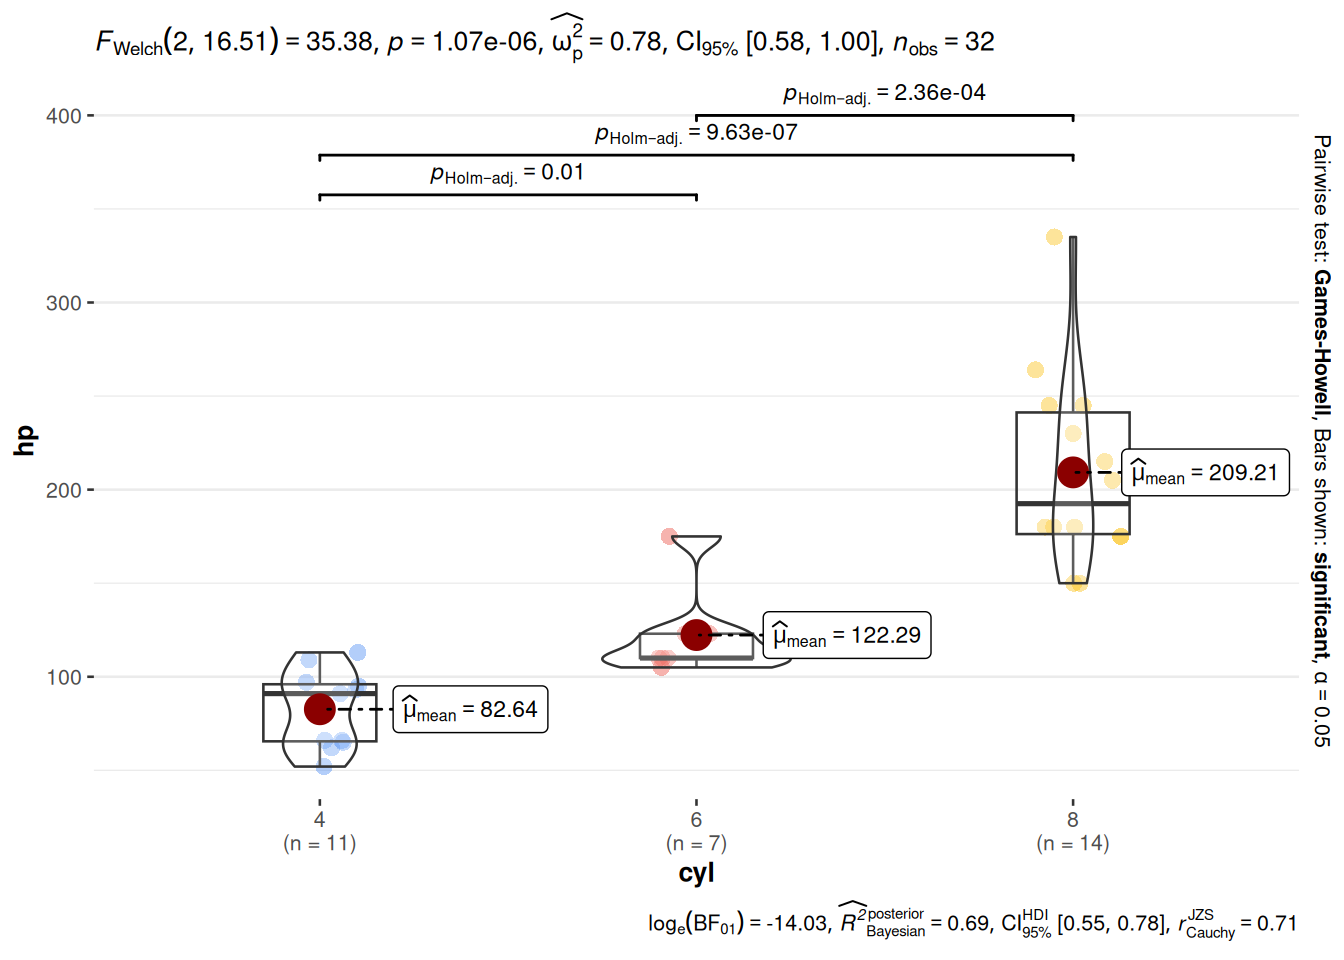
Eine einfache Interpretation lautet, dass R-Quadrat in der Population auf [.54,.77] (95%-HDI) geschätzt wird.
Aufgabenname: ggstatsplot01
Meta-information
extype: string exsolution: NA exname: ggstatsplot01 expoints: 1