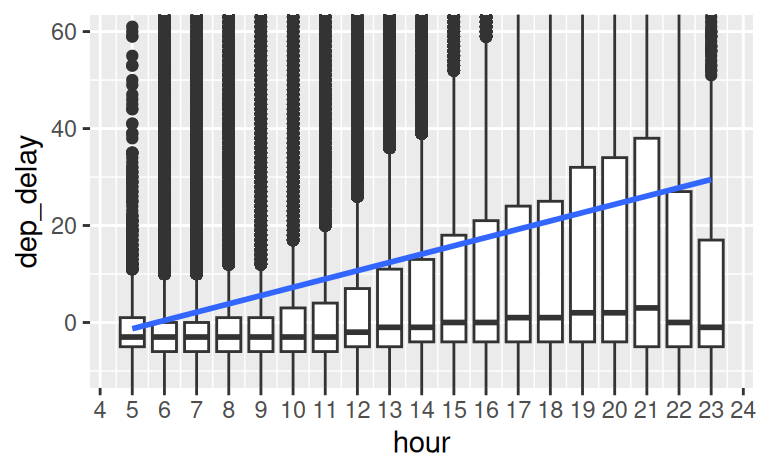
flights-geom_point-geom-lm
paper
todo
schoice
Question
Was ist der richtige R-Code, um das Diagramm zu erzeugen?
**R-Code A**

flights %>%
  select(dep_delay, hour) %>%
  ggplot(aes(x = hour, y = dep_delay)) +
  geom_boxplot(aes(group = hour)) +
  coord_cartesian(ylim = c(-10, 60)) +
  scale_x_continuous(breaks = 1:24)


**R-Code B**

flights %>%
  select(dep_delay, hour) %>%
  ggplot(aes(x = hour, y = dep_delay)) +
  geom_boxplot(aes(group = hour)) +
  geom_smooth(method = 'lm') +
  coord_cartesian(ylim = c(-10, 60)) +
  scale_x_continuous(breaks = 1:24)


**R-Code C**

flights %>%
  ggplot(aes(x = hour, y = dep_delay)) +
  geom_boxplot(aes(group = hour)) +
  geom_smooth() +
  coord_cartesian(ylim = c(-10, 60)) +
  scale_x_continuous(breaks = 1:24)


**R-Code D**

flights %>%
  select(dep_delay, hour) %>%
  ggplot(aes(y = hour, x = dep_delay)) +
  geom_boxplot(aes(group = dep_delay)) +
  geom_smooth(method = 'lm') +
  coord_cartesian(ylim = c(-10, 60)) +
  scale_x_continuous(breaks = 1:24)


**R-Code E**

flights %>%
  select(arr_delay, hour) %>%
  ggplot(aes(x = hour, y = arr_delay)) +
  geom_boxplot(aes(group = hour)) +
  geom_smooth(method = 'lm') +
  coord_cartesian(ylim = c(-10, 60))
Solution
Der Code-Auszug B ist korrekt.
Aufgabenname: flights-geom_point-geom-lm
Meta-information
exname: flights-geom_point-geom-lm extype: schoice expoints: 1 exsolution: 01000 exshuffle: false