Rows: 53,940
Columns: 10
$ carat   <dbl> 0.23, 0.21, 0.23, 0.29, 0.31, 0.24, 0.24, 0.26, 0.22, 0.23, 0.…
$ cut     <ord> Ideal, Premium, Good, Premium, Good, Very Good, Very Good, Ver…
$ color   <ord> E, E, E, I, J, J, I, H, E, H, J, J, F, J, E, E, I, J, J, J, I,…
$ clarity <ord> SI2, SI1, VS1, VS2, SI2, VVS2, VVS1, SI1, VS2, VS1, SI1, VS1, …
$ depth   <dbl> 61.5, 59.8, 56.9, 62.4, 63.3, 62.8, 62.3, 61.9, 65.1, 59.4, 64…
$ table   <dbl> 55, 61, 65, 58, 58, 57, 57, 55, 61, 61, 55, 56, 61, 54, 62, 58…
$ price   <int> 326, 326, 327, 334, 335, 336, 336, 337, 337, 338, 339, 340, 34…
$ x       <dbl> 3.95, 3.89, 4.05, 4.20, 4.34, 3.94, 3.95, 4.07, 3.87, 4.00, 4.…
$ y       <dbl> 3.98, 3.84, 4.07, 4.23, 4.35, 3.96, 3.98, 4.11, 3.78, 4.05, 4.…
$ z <dbl> 2.43, 2.31, 2.31, 2.63, 2.75, 2.48, 2.47, 2.53, 2.49, 2.39, 2.…diamonds-histogram-rcode
paper
todo
Question
In dieser Aufgaben analysieren wir den Datensatz diamonds, welcher Merkmale von Diamanten (wie Preis, Schliffart etc.) auflistet. Hier ist ein Blick in den Datensatz:
diamonds ist Teil von Tidyverse (genauer gesagt dem Paket {ggplot2}).
Hier ist ein Überblick über die deskriptiven, univariaten Statistiken:
| Name | diamonds |
| Number of rows | 53940 |
| Number of columns | 10 |
| _______________________ | |
| Column type frequency: | |
| factor | 3 |
| numeric | 7 |
| ________________________ | |
| Group variables | None |
Variable type: factor
| skim_variable | n_missing | complete_rate | ordered | n_unique | top_counts |
|---|---|---|---|---|---|
| cut | 0 | 1 | TRUE | 5 | Ide: 21551, Pre: 13791, Ver: 12082, Goo: 4906 |
| color | 0 | 1 | TRUE | 7 | G: 11292, E: 9797, F: 9542, H: 8304 |
| clarity | 0 | 1 | TRUE | 8 | SI1: 13065, VS2: 12258, SI2: 9194, VS1: 8171 |
Variable type: numeric
| skim_variable | n_missing | complete_rate | mean | sd | p0 | p25 | p50 | p75 | p100 | hist |
|---|---|---|---|---|---|---|---|---|---|---|
| carat | 0 | 1 | 0.80 | 0.47 | 0.2 | 0.40 | 0.70 | 1.04 | 5.01 | ▇▂▁▁▁ |
| depth | 0 | 1 | 61.75 | 1.43 | 43.0 | 61.00 | 61.80 | 62.50 | 79.00 | ▁▁▇▁▁ |
| table | 0 | 1 | 57.46 | 2.23 | 43.0 | 56.00 | 57.00 | 59.00 | 95.00 | ▁▇▁▁▁ |
| price | 0 | 1 | 3932.80 | 3989.44 | 326.0 | 950.00 | 2401.00 | 5324.25 | 18823.00 | ▇▂▁▁▁ |
| x | 0 | 1 | 5.73 | 1.12 | 0.0 | 4.71 | 5.70 | 6.54 | 10.74 | ▁▁▇▃▁ |
| y | 0 | 1 | 5.73 | 1.14 | 0.0 | 4.72 | 5.71 | 6.54 | 58.90 | ▇▁▁▁▁ |
| z | 0 | 1 | 3.54 | 0.71 | 0.0 | 2.91 | 3.53 | 4.04 | 31.80 | ▇▁▁▁▁ |
Betrachten Sie das Histogramm; welcher R-Code hat es erzeugt?
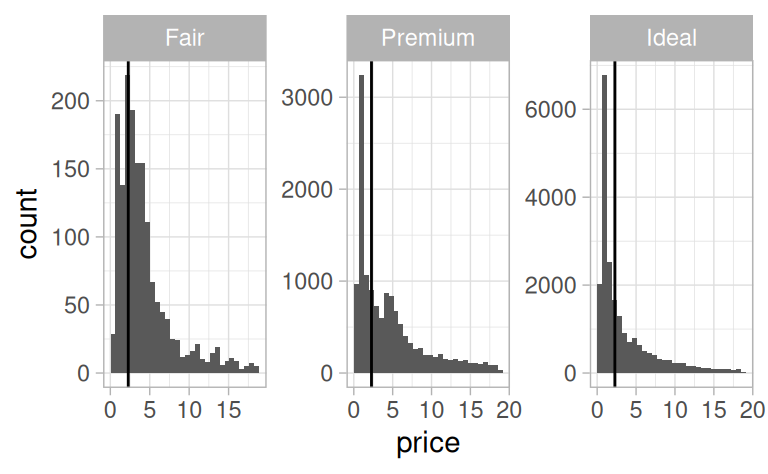
Für alle Diagramme gilt:
A
diamonds %>%
  mutate(price = price/1000 %>% round) %>%
  ggplot() +
  aes(x = price) +
  geom_histogram()  +
  geom_vline(aes(xintercept = mean(price))) +
  theme_light() +
  facet_wrap( ~ cut, scales = "free")
B
diamonds %>%
  drop_na(cut, price) %>%
  filter(cut %in% c("Fair", "Premium", "Ideal")) %>%
  mutate(price = price/1000 %>% round) %>%
  ggplot() +
  aes(x = price) +
  geom_histogram()  +
  geom_vline(aes(xintercept = median(price))) +
  theme_light() +
  facet_wrap( ~ cut, scales = "free")
C
diamonds %>%
  drop_na(cut, price) %>%
  filter(cut %in% c("Fair", "Premium", "Ideal")) %>%
  ggplot() +
  aes(x = price) +
  geom_histogram()  +
  geom_vline(aes(xintercept = median(price)))
  facet_wrap(cut)
D
diamonds %>%
  drop_na(cut, price) %>%
  filter(cut %in% c("Fair", "Premium", "Ideal")) %>%
  ggplot() +
  aes(x = price) +
  geom_histogram()  +
  geom_vline(aes(xintercept = median(price))) +
  theme_light() +
  facet_wrap( ~ cut, scales = "free")
Answerlist
- Code-Beispiel A
- Code-Beispiel B
- Code-Beispiel C
- Code-Beispiel D
- Keine Antwort möglich
Solution
Code B passt zum Diagramm.
Aufgabenname: diamonds-histogram-rcode
Answerlist
- Falsch
- Richtig
- Falsch
- Falsch
- Falsch
Meta-information
exname: diamonds-histogram-rcode extype: schoice exsolution: 01000 exshuffle: TRUE expoints: 1