---
title: boxplots
date: '2026-07-14'
categories:
- paper
- todo
- en
- mchoice
---

```{r data generation, echo = FALSE, results = "hide"}
library(exams)

## convenience functions
SK <- function(x) diff(diff(fivenum(x)[2:4]))/diff(fivenum(x)[c(2, 4)])
trob <- function(a, b)
  (median(a) - median(b))/sqrt(var(a)/length(a) + var(b)/length(b))

## DATA GENERATION
## dgp for one sample
dgp <- function(location = 0, scale = 1, skewed = FALSE, outlier = NULL,
  n = 10, amount = 0.1)
{
  ## basic intervals from which equal amounts of observations are drawn
  qq <- if (skewed) c(0, 2, 2.2, 6, 10) else c(0, 3, 5, 7, 10)
  sim <- function(x) {
    rval <- NULL
    for(i in 1:(length(x)-1)) rval <- c(rval, runif(n, min = x[i], max = x[i+1]))
    rval <- jitter(rval, amount = amount)
    rval <- rval/4
    rval
  }
  ## draw under restrictions about IQR and SK
  rval <- sim(qq)
  if (skewed) {
    while(IQR(rval) > 1.15 | IQR(rval) < 0.85 | abs(SK(rval)) < 0.7) rval <- sim(qq)
  } else {
    while(IQR(rval) > 1.15 | IQR(rval) < 0.85 |abs(SK(rval)) > 0.15) rval <- sim(qq)
  }

  ## raw values (location = 0, scale = 1)
  rval <- rval - ifelse(skewed, 0.55, 1.25)

  ## add outliers
  rval <- c(rval, outlier)

  ## scale and shift
  rval <- rval * scale + location

  return(rval)
}

## generate random parameters for dgp()
scale <- sample(c(1, sample(c(1, 3), 1))) * runif(1, min = 0.5, max = 10) * sample(c(-1, 1), 1)
location <- sample(c(0, sample(c(0, 2), 1))) * scale + runif(1, min = -50, max = 50)
skewed <- if (runif(1) < 2/3) c(FALSE, FALSE) else sample(c(TRUE, sample(c(TRUE, FALSE), 1)))
if (runif(1) < 2/3) {
  outlier <- list(NULL, NULL)
} else {
  if (any(skewed)) {
    outlier <- if (skewed[1]) -sign(scale[1]) * runif(sample(1:2, 1), min = 3, max = 4) else NULL
    outlier <- c(list(outlier), if (skewed[2])
      list(-sign(scale[1]) * runif(sample((0:1 + !skewed[1]), 1), min = 3, max = 4)) else list(NULL))
  } else {
    outlier <- runif(sample(1:3, 1), min = 3, max = 4)
    outlier <- outlier * sample(c(-1, 1), length(outlier), replace = TRUE)
    id <- sample(1:length(outlier), sample(1:length(outlier), 1))
    outlier1 <- outlier[id]
    outlier2 <- outlier[-id]
    outlier <- list(if(length(outlier1) > 0) outlier1 else NULL,
      if (length(outlier2) > 0) outlier2 else NULL)
  }
}

## call dgp under certain constrains
A <- dgp(location = location[1], scale = scale[1], skewed = skewed[1], outlier = outlier[[1]],
  n = sample(8:12, 1))
B <- dgp(location = location[2], scale = scale[2], skewed = skewed[2], outlier = outlier[[2]],
  n = sample(8:12, 1))
while((length(unique(location)) < 2 & abs(trob(A, B)) > 0.4) | (abs(SK(A)) > 0.15 & abs(SK(A)) < 0.7) | (abs(SK(B)) > 0.15 & abs(SK(B)) < 0.7)) {
  A <- dgp(location = location[1], scale = scale[1], skewed = skewed[1], outlier = outlier[[1]],
    n = sample(8:12, 1))
  B <- dgp(location = location[2], scale = scale[2], skewed = skewed[2], outlier = outlier[[2]],
    n = sample(8:12, 1))
}
SK_A <- ifelse(abs(SK(A)) < 0.2, "symmetric", ifelse(SK(A) >= 0.2, "right-skewed", "left-skewed"))
SK_B <- ifelse(abs(SK(B)) < 0.2, "symmetric", ifelse(SK(B) >= 0.2, "right-skewed", "left-skewed"))

## QUESTION/ANSWER GENERATION
questions <- character(5)
solutions <- logical(5)
explanations <- character(5)

questions[1] <- "The location of both distributions is about the same."
solutions[1] <- abs(trob(A, B)) < 0.5
explanations[1] <- if (solutions[1]) "Both distributions have a similar location." else
  paste("Distribution ", c("A", "B")[(median(A) < median(B)) + 1],
    " has on average higher values than distribution ",
    c("A", "B")[(median(A) >= median(B)) + 1], ".", sep = "")

outlier <- length(unlist(outlier)) > 0
questions[2] <- "Both distributions contain no outliers."
solutions[2] <- !outlier
explanations[2] <- if (solutions[2])
  "Both distributions have no observations which deviate more than 1.5 times the interquartile range from the box." else "There are observations which deviate more than 1.5 times the interquartile range from the median."

questions[3] <- "The spread in sample A is clearly bigger than in B."
solutions[3] <- IQR(A)/IQR(B) > 1.5
explanations[3] <- paste("The interquartile range in sample A is",
  ifelse(solutions[3], "", "_not_"), "clearly bigger than in B.")

questions[4] <- "The skewness of both samples is similar."
solutions[4] <- SK_A == SK_B
explanations[4] <- if (solutions[4]) paste("The skewness of both distributions is similar, both are",
    ifelse(abs(SK(A)) < 0.2, "about symmetric.", ifelse(SK(A) >= 0.2, "right-skewed.", "left-skewed."))) else
    paste("The skewness of both distributions is different. Sample A is",
    ifelse(abs(SK(A)) < 0.2, "about symmetric.", ifelse(SK(A) >= 0.2, "right-skewed.", "left-skewed.")),
    "Sample B is", ifelse(abs(SK(B)) < 0.2, "about symmetric.", ifelse(SK(B) >= 0.2, "right-skewed.", "left-skewed.")))

i <- sample(1:2, 1)
j <- sample(1:3, 1)
questions[5] <- paste("Distribution ", c("A", "B")[i], " is ",
                      c("about symmetric", "right-skewed", "left-skewed")[j], ".", sep = "")
SK_i <- SK(list(A, B)[[i]])
solutions[5] <- switch(j, abs(SK_i) < 0.2,
                       SK_i >= 0.2,
                       SK_i <= -0.2)
explanations[5] <- paste("Distribution ", c("A", "B")[i], " is ",
                         ifelse(abs(SK_i) < 0.2, "about symmetric.",
                                ifelse(SK_i >= 0.2, "right-skewed.", "left-skewed.")))
```

Question
========
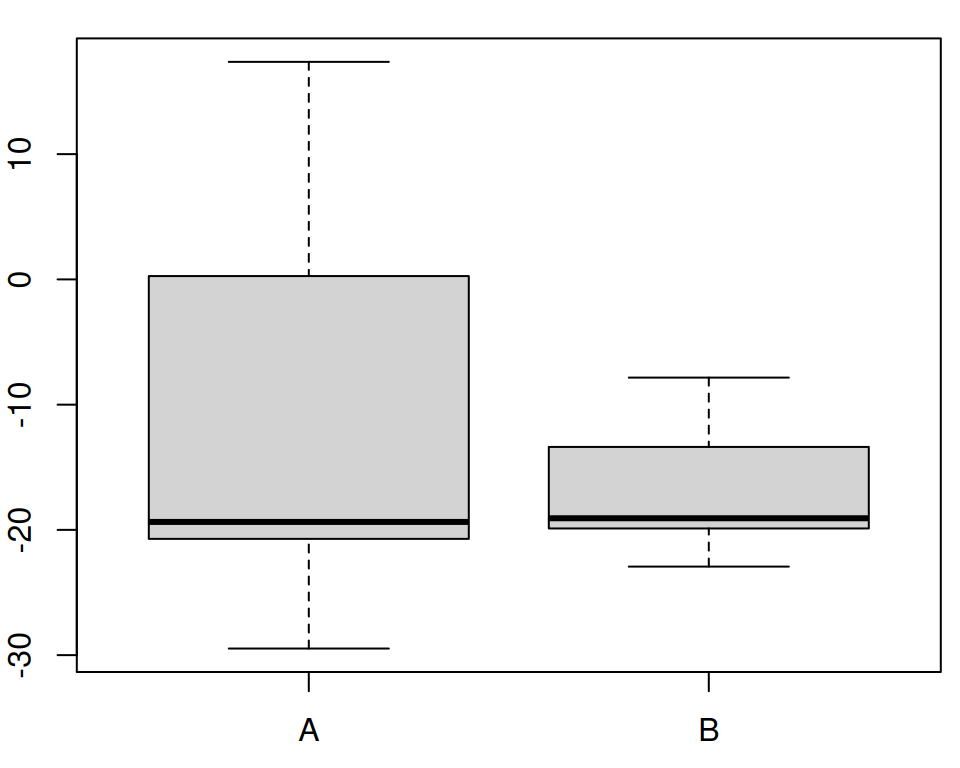
In the following figure the distributions of a variable
given by two samples (A and B) are represented by parallel boxplots.
Which of the following statements are correct?  _(Comment: The
statements are either about correct or clearly wrong.)_
\
```{r boxplot, echo = FALSE, results = "hide", fig.height = 4, fig.width = 5, fig.path = "", fig.cap = ""}
par(mar = c(2.5, 2, 1, 0.5))
dat <- data.frame(y = c(A, B), x = factor(rep(c("A", "B"), c(length(A), length(B)))))
boxplot(y ~ x, data = dat, xlab = "", ylab = "")
```

```{r questionlist, echo = FALSE, results = "asis"}
answerlist(questions, markup = "markdown")
```


Solution
========


Aufgabenname: `boxplots`


```{r solutionlist, echo = FALSE, results = "asis"}
answerlist(ifelse(solutions, "True", "False"), explanations, markup = "markdown")
```

Meta-information
================
extype: mchoice
expoints: 1
exsolution: `r mchoice2string(solutions)`
exname: boxplots