---
title: boxhist2
date: '2026-07-14'
categories: null
---

```{r data generation, echo = FALSE, results = "hide"}
library(exams)

## DATA
n <- sample(30:50, 1)
m <- sample(1:4, 1)
s <- runif(1, 0.5, 2)
delta <- ifelse(runif(1) < 0.2, sample(8:12), 0)
p2 <- runif(1, 0.45, 0.55)
skewed <- left <- FALSE
if(!delta) {
    skewed <- runif(1) < 0.6
    left <- runif(1) < 0.3
}

dgpBoxhist <- function(n = 40, mean = 0, sd = 1, delta = 0,
  p2 = 0.5, skewed = FALSE, left = FALSE)
{
  SK <- function(x) abs(diff(diff(fivenum(x)[2:4]))/diff(fivenum(x)[c(2, 4)]))
  sim <- function(x){
    x <- rnorm(n)
    if(skewed) exp(x) else x
  }

  x <- sim()
  if(skewed) while(SK(x) < 0.7) x <- sim() else while(SK(x) > 0.15) x <- sim()
  if(left) x <- -x

  x <- mean + sd * scale(x)
  k <- sample(1:n, round(p2 * n))
  x[k] <- x[k] + delta
  as.vector(sample(x))
}
x <- round(dgpBoxhist(n = n, mean = m, sd = s, delta = delta,
  p2 = p2, skewed = skewed, left = left), digits = 2)

b <- boxplot(x, plot = FALSE)
spread <- tol <- signif(diff(range(c(b$stats, b$out)))/25, 1)

write.csv(data.frame(x), file = "boxhist.csv", quote = FALSE, row.names = FALSE)

## QUESTION/SOLUTION
questions <- solutions <- explanations <- rep(list(""), 6)
type <- rep(list("schoice"), 6)

questions[[1]] <- c("true", "false")
solutions[[1]] <- c(delta < 1, delta > 1)

questions[[2]] <- c("symmetric", "right-skewed", "left-skewed")
solutions[[2]] <- c(!skewed, skewed & !left, skewed & left) ## FIXME: !skewed -> !skewed | delta ?

questions[[3]] <- c("true", "false")
solutions[[3]] <- c(length(b$out) > 0, length(b$out) < 1)

questions[[4]] <- ""
solutions[[4]] <- explanations[[4]] <- signif(b$stats[[2]], 3)
type[[4]] <- "num"

questions[[5]] <- ""
solutions[[5]] <- explanations[[5]] <- signif(b$stats[[4]], 3)
type[[5]] <- "num"

smallgreat <- sample(c("smaller", "greater"), 1)
questions[[6]] <- ""
solutions[[6]] <- explanations[[6]] <- signif(b$stats[[3]], 3)
type[[6]] <- "num"

explanations[1:3] <- lapply(solutions[1:3], function(x) ifelse(x, "True", "False"))
solutions[1:3] <- lapply(solutions[1:3], mchoice2string)
if(any(explanations[4:6] < 0)) explanations[4:6] <- lapply(solutions[4:6], function(x) paste("$", x, "$", sep = ""))
```


Question
========
For the `r n` observations of the variable `x` in the data file
[boxhist.csv](boxhist.csv) draw a histogram, a boxplot and a stripchart.
Based on the graphics, answer the following questions or check the correct
statements, respectively. _(Comment: The tolerance for numeric answers is
$\pm`r tol`$, the true/false statements are either about correct or clearly wrong.)_

|                                                   |                 |
|:--------------------------------------------------|:----------------|
| The distribution is unimodal:             | \#\#ANSWER1\#\# |
| The distribution is:                  | \#\#ANSWER2\#\# |
| The boxplot shows outliers:               | \#\#ANSWER3\#\# |
| A quarter of the observations is smaller than:    | \#\#ANSWER4\#\# |
| A quarter of the observations is greater than:    | \#\#ANSWER5\#\# |
| Half of the observations are `r smallgreat` than: | \#\#ANSWER6\#\# |

```{r questionlist, echo = FALSE, results = "asis"}
answerlist(unlist(questions), markup = "markdown")
```


Solution
========
\
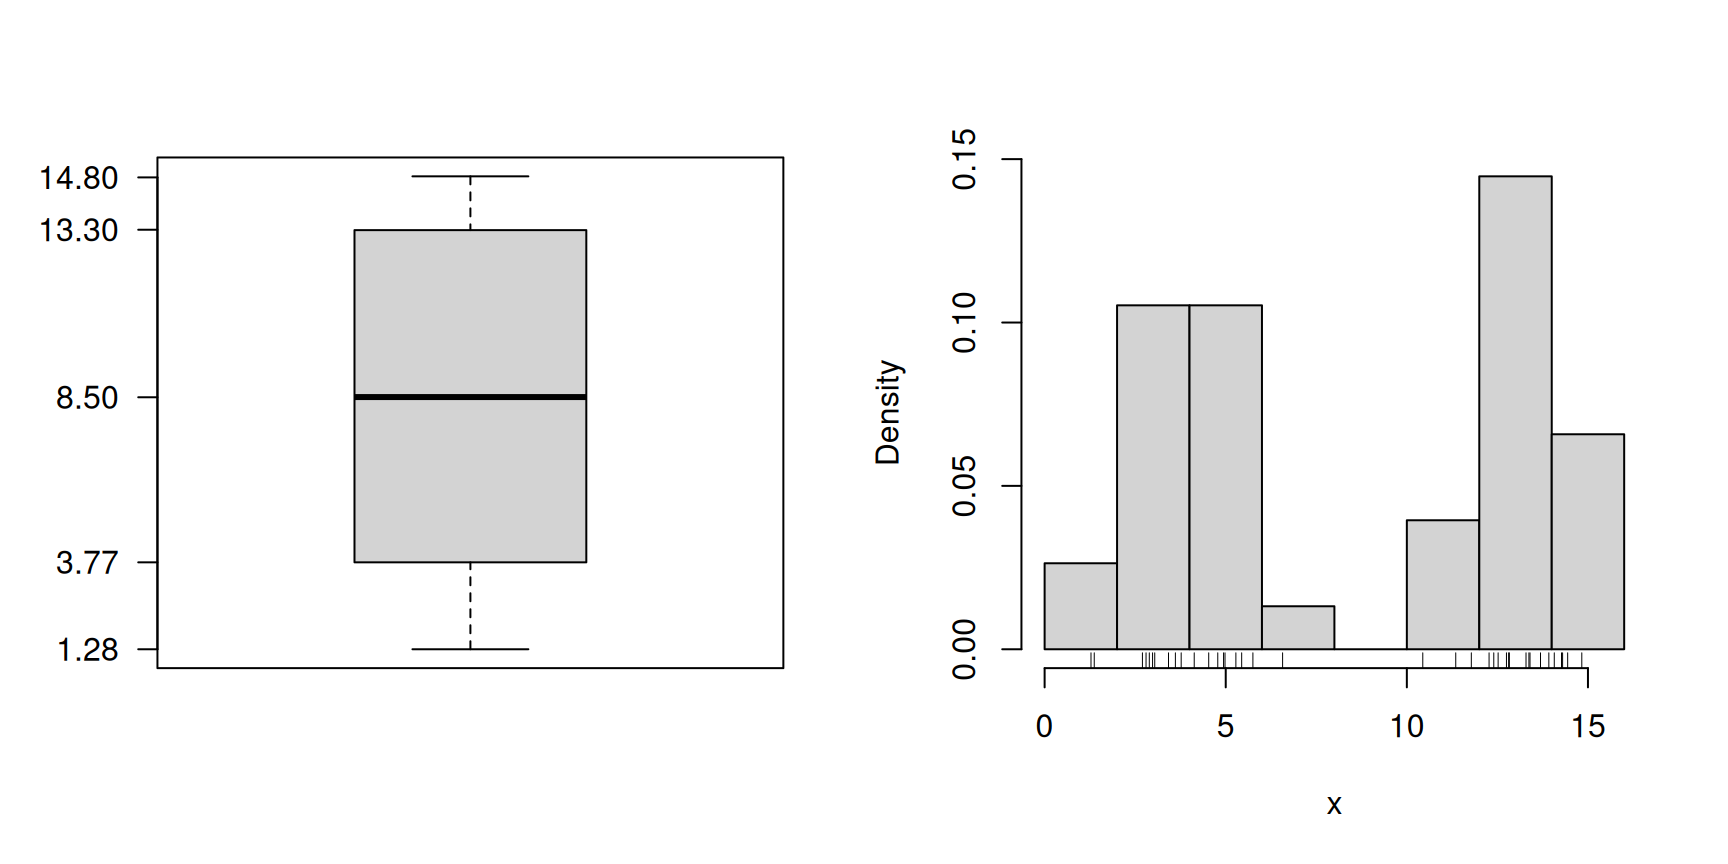
```{r boxplot_hist, echo = FALSE, results = "hide", fig.height = 4.5, fig.width = 9, fig.path = "", fig.cap = ""}
par(mfrow = c(1, 2))
boxplot(x, axes = FALSE)
axis(2, at = signif(b$stats, 3), las = 1)
box()
hist(x, freq = FALSE, main = "")
rug(x)
```


Aufgabenname: `boxhist2`


```{r solutionlist, echo = FALSE, results = "asis"}
answerlist(paste(unlist(explanations), ".", sep = ""), markup = "markdown")
```


Meta-information
================
extype: cloze
expoints: 1
exsolution: `r paste(solutions, collapse = "|")`
exclozetype: `r paste(type, collapse = "|")`
exname: boxhist2
extol: 0|0|0|`r tol`|`r tol`|`r tol`