UPDATE 2018-12-03
Thanks to a comment by Katharina Hees and Joyce, I know know how to plot two images side by side in an Rmd file.
I kept wondering who to plot two R plots side by side (ie., in one “row”) in a .Rmd chunk. Here’s a way, well actually a number of ways, some good, some … not.
library(tidyverse)
library(gridExtra)
library(grid)
library(png)
library(downloader)
library(grDevices)

data(mtcars)
Plots from ggplot
Say, you have two plots from ggplot2, and you would like them to put them next to each other, side by side (not underneath each other):
ggplot(mtcars) +
  aes(x = hp, y = mpg) +
  geom_point() -> p1

ggplot(mtcars) +
  aes(x = factor(cyl), y = mpg) +
  geom_boxplot() +
  geom_smooth(aes(group = 1), se = FALSE) -> p2

grid.arrange(p1, p2, ncol = 2)
So, grid.arrange is the key.
Plots from png-file
comb2pngs <- function(imgs, bottom_text = NULL){
  img1 <-  grid::rasterGrob(as.raster(readPNG(imgs[1])),
                            interpolate = FALSE)
  img2 <-  grid::rasterGrob(as.raster(readPNG(imgs[2])),
                            interpolate = FALSE)
  grid.arrange(img1, img2, ncol = 2, bottom = bottom_text)
}
The code of this function was inspired by code from Ben from this SO post.
Now, let’s load two pngs and then call the function above.
First, get the images:
png1_path <- "https://sebastiansauer.github.io/images/2016-08-30-03.png"
png2_path <- "https://sebastiansauer.github.io/images/2016-08-31-01.png"

#download(png1_path, destfile = png1_dest)
#download(png2_path, destfile = png2_dest)

png1_dest <- "/images/img1.png"
png2_dest <- "/images/img2.png"
Now plot it:
comb2pngs(c(png1_dest, png2_dest))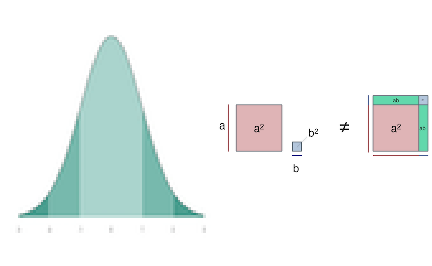
This works, it produces two plots from png files side by side.
Two plots side-by-side the knitr way. Does not work.
But what about the standard knitr way?
knitr::include_graphics(c(png1_path,png2_path))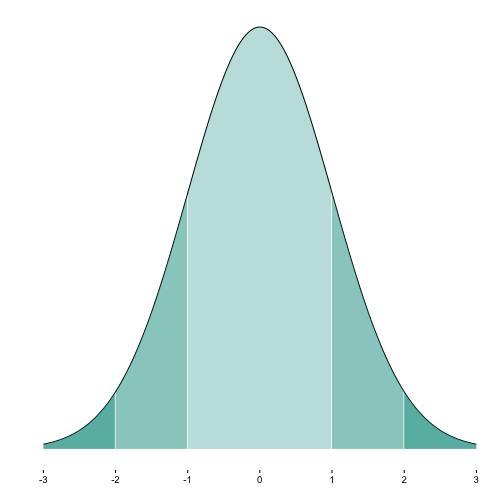
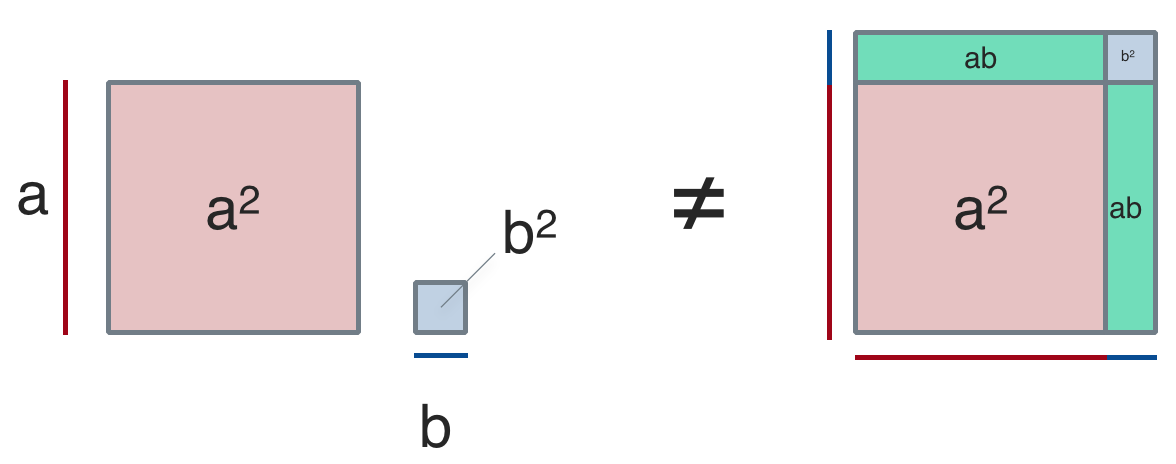
Does not work.
Maybe with only one value for out.width??
knitr::include_graphics(c(png1_dest, png2_dest))


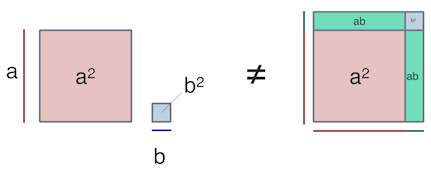
Nope. Does not work.
Does not work either, despite some saying so.
Maybe two times include_graphics?
imgs <- c(png1_dest, png2_dest)
imgs
#> [1] "https://sebastiansauer.github.io/images/2017-10-12/img1.png"
#> [2] "https://sebastiansauer.github.io/images/2017-10-12/img2.png"

knitr::include_graphics(png1_dest);  knitr::include_graphics(png2_dest)
An insight why include_graphics fails
No avail. Looking at the html code in the md-file which is produced by the knitr -call shows one interesting point: all this version of include_graphics produce the same code. And all have this style="display: block; margin: auto;" part in it. That obviously created problems. I am unsure who to convince include_graphics to divorce from this argument. I tried some versions of the chunk argument fig.show = hold, but to no avail.
It works with the right chunk options
To get the two images side by side (next to each other/ in a row), two options must be set
- the total width of the images must not exeed the maximum width
- the images should be shown after all codes is executed, ie., the images must be “held”
See this code snippet:
```{r out.width='30%', fig.show='hold'}
knitr::include_graphics(c(png1_path, png2_path))
```
knitr::include_graphics(c(png1_path, png2_path))
Plain markdown works, too
Try this code
{ width=30% } { width=40% }
The two commands ![]... need not appear in one row. However, no new paragraph may separate them (no blank line between, otherwise the images will appear one below the other).
Works. But the markdown way does not give the fill comfort and power. So, that’s not quite perfect.