library(tidyverse)
library(ggpubr)saratoga-cor2
R
vis
causal
eda
Aufgabe
Importieren Sie den Datensatz saratoga.
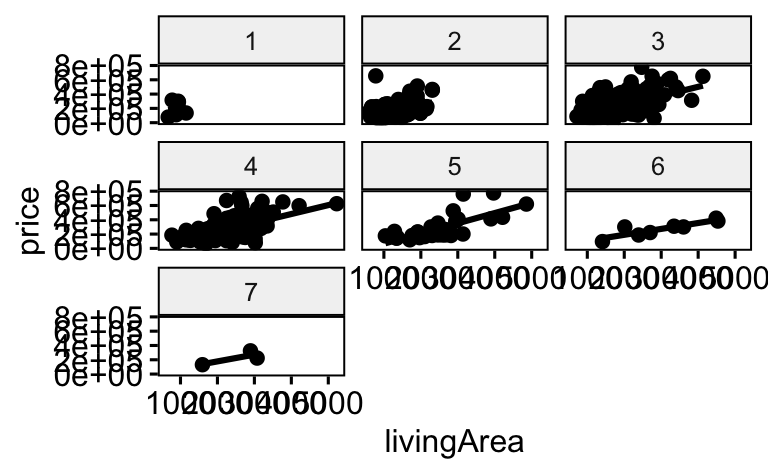
Berechnen Sie dann den Zusammenhang zwischen price und livingArea pro Stufe von bedrooms.
Hinweise:
- Beachten Sie die Standardhinweise des Datenwerks.
Lösung
Setup
data("SaratogaHouses", package = "mosaicData")Gruppieren
d2 <-
  SaratogaHouses |>
  group_by(bedrooms)
Statistiken
d2 |>
summarise(korrelation = cor(livingArea, price))| bedrooms | korrelation |
|---|---|
| 1 | 0.1145486 |
| 2 | 0.5097218 |
| 3 | 0.6358629 |
| 4 | 0.6872350 |
| 5 | 0.7214769 |
| 6 | 0.8818375 |
| 7 | 0.7905541 |
Visualisierung
ggscatter(d2,
          x = "livingArea",
          y = "price",
          facet.by = "bedrooms",
          add = "reg.line")