library(tidyverse)
library(easystats)
library(ggpubr)  # visualization

# import data:
penguins <- read.csv("https://vincentarelbundock.github.io/Rdatasets/csv/palmerpenguins/penguins.csv")penguins-lm2
lm
en
regression
penguins
1 Exercise
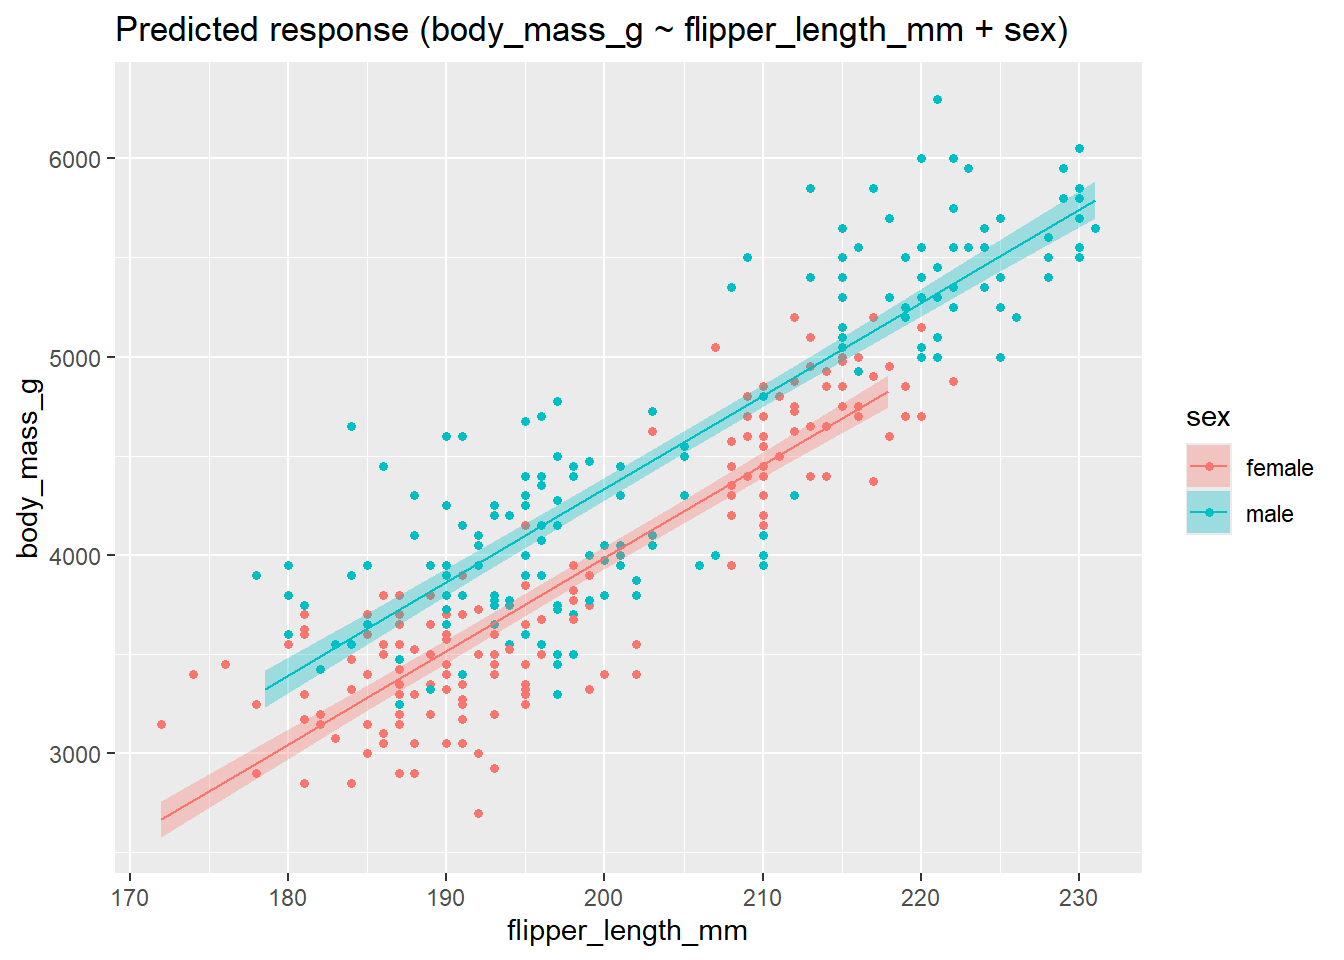
Consider the dataset penguins. Compute a linear model with body mass as output variable (DV) and a) flipper length and b) sex as input (IV).
- Tidy up the data set, if and where needed.
- Report the coefficients and interpret them.
- Plot the model and the coefficients.
- Report the model fit (R squared).
- BONUS:
predict()the weight of an average flipper-sized animal (male and female). Check out the internet for examples of how to do so in case you need support.
2 Solution
2.1 Setup
2.2 Tidy up
penguins_tidier <-
  penguins |>
  select(body_mass_g, flipper_length_mm, sex) |>
  drop_na() |>
  filter(sex != "")  # maybe better to be excluded
Note that, strangely, there are some animals for which the sex is reported as "", an empty string value. This is not the same as NA. However, we may want the exclude such animals of unclear sex.
2.3 Let’s go
lm2 <-
  lm(body_mass_g ~ flipper_length_mm + sex,
          data = penguins_tidier)
Plot the model:
plot(estimate_relation(lm2))