library(tidyverse)gini-plot
2023
vis
statlearning
trees
string
Aufgabe
Visualisieren Sie die Gini-Funktion!
Lösung
granularity <- .1
x1 = seq(from = 0, to = 1, by = granularity)
x2 = seq(from = 1, to = 0, by = -granularity)
#x2 <- 1 - x1

d <- expand_grid(x1, x2)
Gini-Loss:
gini_loss <- function(x1, x2) {1 - (x1^2 + x2^2)}Funktion berechnen:
d2 <-
  d %>%
  rowwise() %>%
  mutate(y = gini_loss(x1, x2))
# d2 <-
# outer(x1, x3, FUN = gini_loss) %>%
# as_tibble() %>%
# pivot_longer(cols = everything())# d <-
# d %>%
# mutate(
# x3 = 1 - x1,
# y = 1 - (x1^2 + x3^2))d2 %>%
ggplot(aes(x1, x2, fill = y)) +
geom_tile() +
scale_x_continuous(limits = c(-2, 2)) +
scale_y_continuous(limits = c(-2, 2))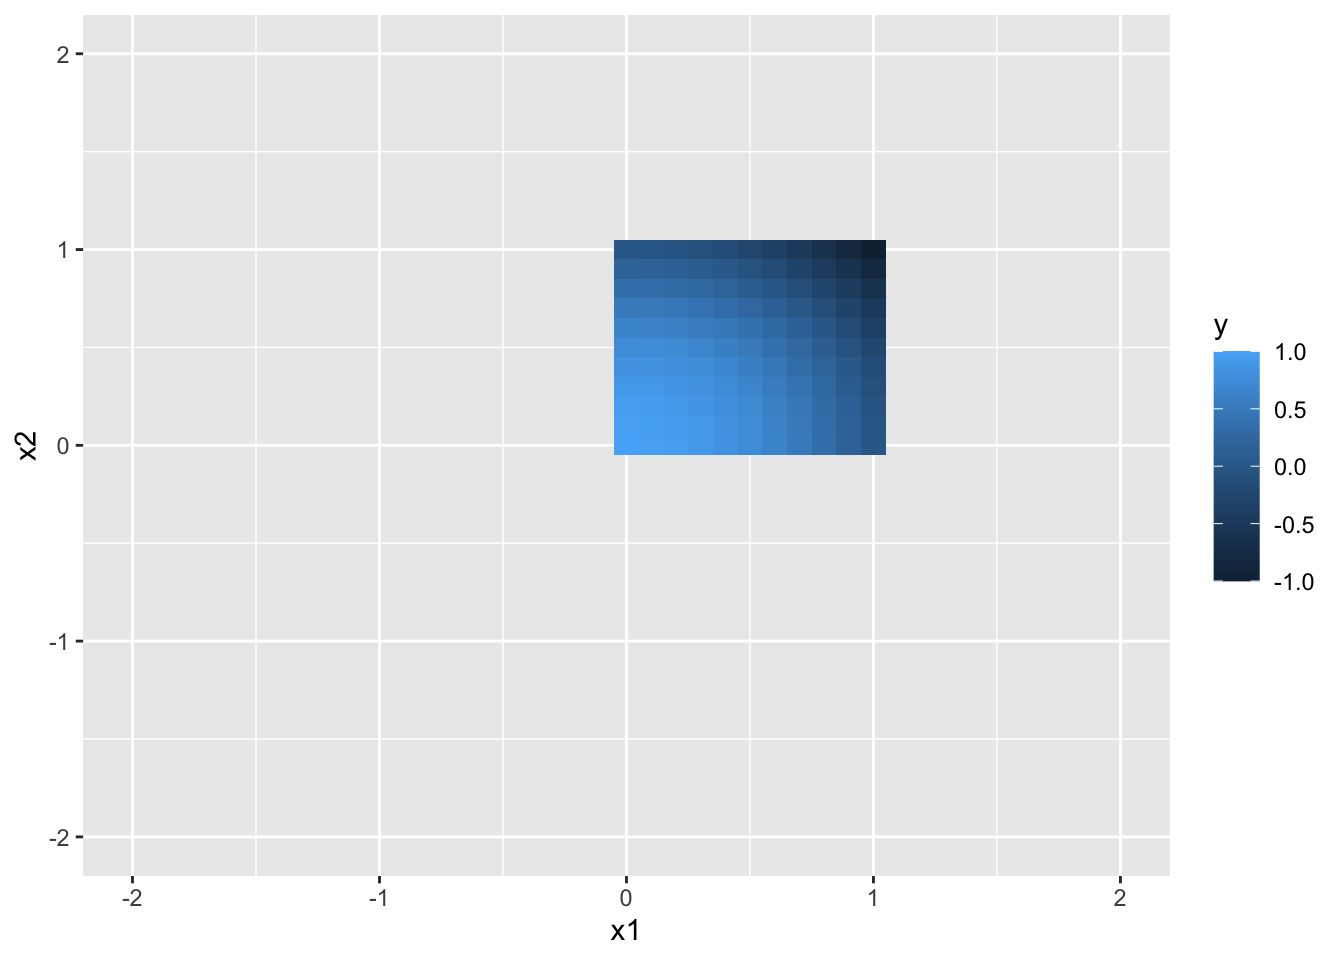
So sieht der Funktionsgraph in Geogebra aus.
Categories:
- 2023
- vis
- statlearning
- tree
- string