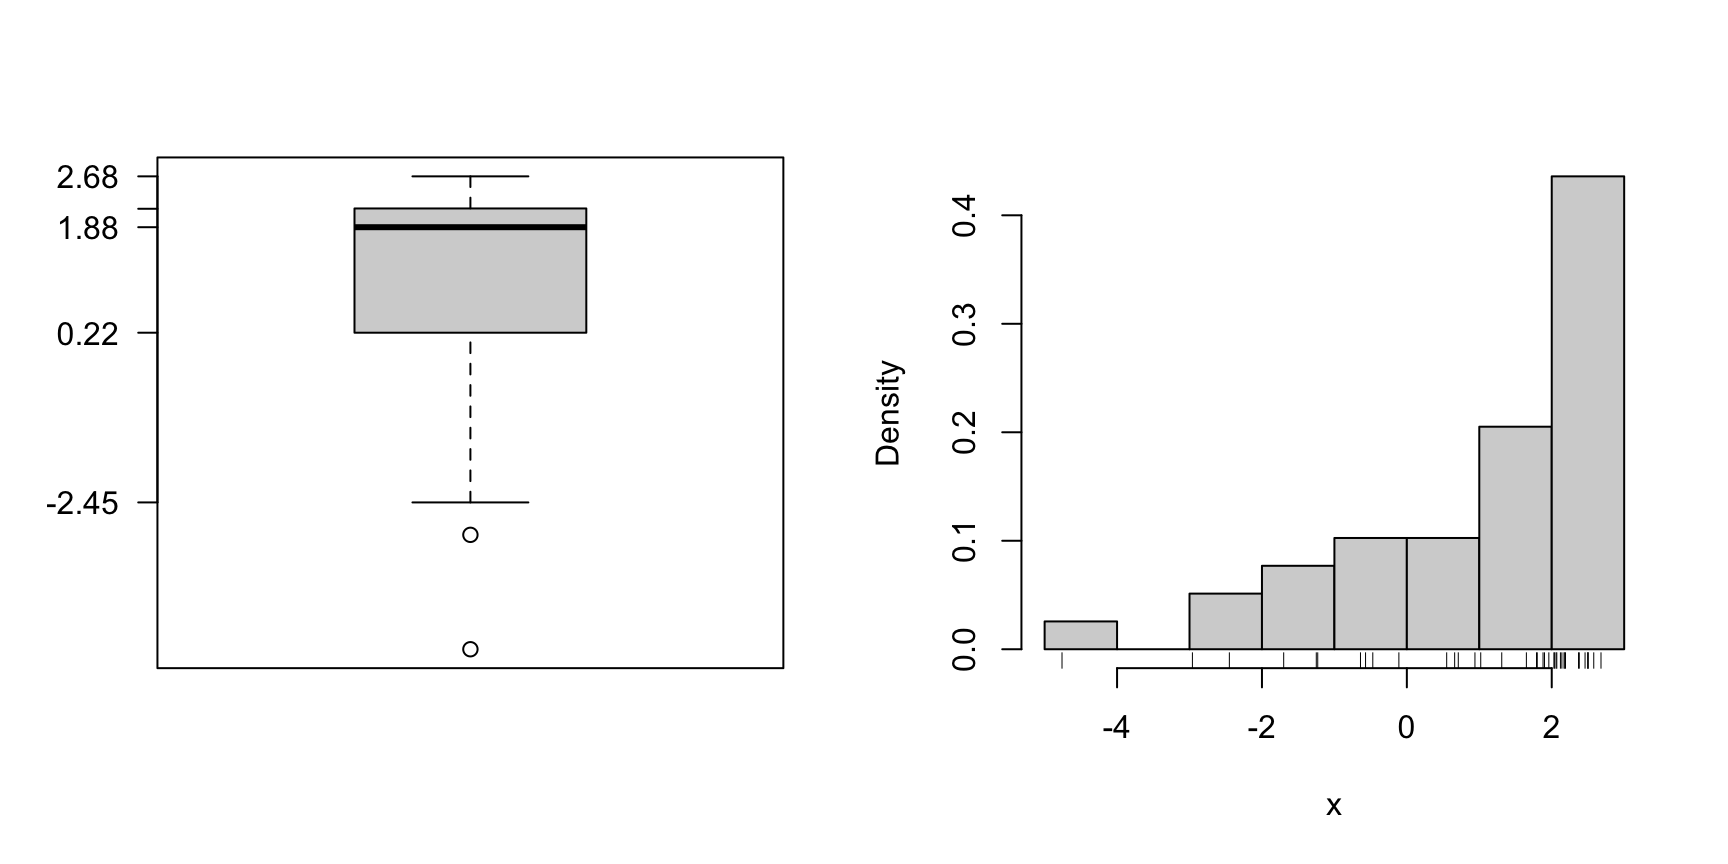
boxhist.csv draw a histogram, and a boxplot. Based on the graphics, answer the following questions or check the correct statements, respectively. (Comment: The tolerance for numeric answers is \(\pm0.2\), the true/false statements are either about correct or clearly wrong.)
Answerlist
The distribution is unimodal.
The distribution is not unimodal.
The distribution is symmetric.
The distribution is right-skewed.
The distribution is left-skewed.
The boxplot shows outliers.
The boxplot shows no outliers.
A quarter of the observations is smaller than which value?
A quarter of the observations is greater than which value?
Half of the observations are greater than which value?
Lösung
Answerlist
True.
False.
False.
False.
True.
True.
False.
0.65.
1.7.
1.55.
Categories:
vis
eda
en
cloze
Source Code
---extype: clozeexsolution: r paste(solutions, collapse = "|")exclozetype: r paste(type, collapse = "|")exname: boxhistextol: r tolcategories:- vis- eda- en- clozedate: '2023-02-26'slug: boxhisttitle: boxhist---```{r data generation, echo = FALSE, results = "hide"}## DATAlibrary(exams)n <-sample(30:50, 1)m <-sample(1:4, 1)s <-runif(1, 0.5, 2)delta <-ifelse(runif(1) <0.2, sample(8:12), 0)p2 <-runif(1, 0.45, 0.55)skewed <- left <-FALSEif(!delta) { skewed <-runif(1) <0.6 left <-runif(1) <0.3}dgpBoxhist <-function(n =40, mean =0, sd =1, delta =0,p2 =0.5, skewed =FALSE, left =FALSE){ SK <-function(x) abs(diff(diff(fivenum(x)[2:4]))/diff(fivenum(x)[c(2, 4)])) sim <-function(x){ x <-rnorm(n)if(skewed) exp(x) else x } x <-sim()if(skewed) while(SK(x) <0.7) x <-sim() elsewhile(SK(x) >0.15) x <-sim()if(left) x <--x x <- mean + sd *scale(x) k <-sample(1:n, round(p2 * n)) x[k] <- x[k] + deltaas.vector(sample(x))}x <-round(dgpBoxhist(n = n, mean = m, sd = s, delta = delta, p2 = p2, skewed = skewed, left = left), digits =2)b <-boxplot(x, plot =FALSE)spread <- tol <-signif(diff(range(c(b$stats, b$out)))/25, 1)write.csv(data.frame(x), file ="boxhist.csv", quote =FALSE, row.names =FALSE)## QUESTION/SOLUTIONquestions <- solutions <- explanations <-rep(list(""), 6)type <-rep(list("schoice"), 6)questions[[1]] <-paste("The distribution is ", c("", "_not_ "), "unimodal.", sep ="")solutions[[1]] <-c(delta <1, delta >1)questions[[2]] <-paste("The distribution is", c("symmetric.", "right-skewed.", "left-skewed."))solutions[[2]] <-c(!skewed, skewed &!left, skewed & left)questions[[3]] <-paste("The boxplot shows ", c("", "_no_ "), "outliers.", sep ="")solutions[[3]] <-c(length(b$out) >0, length(b$out) <1)questions[[4]] <-"A quarter of the observations is smaller than which value?"solutions[[4]] <- explanations[[4]] <-signif(b$stats[[2]], 3)type[[4]] <-"num"questions[[5]] <-"A quarter of the observations is greater than which value?"solutions[[5]] <- explanations[[5]] <-signif(b$stats[[4]], 3)type[[5]] <-"num"questions[[6]] <-paste("Half of the observations are",sample(c("smaller", "greater"), 1), "than which value?")solutions[[6]] <- explanations[[6]] <-signif(b$stats[[3]], 3)type[[6]] <-"num"explanations[1:3] <-lapply(solutions[1:3], function(x) ifelse(x, "True", "False"))solutions[1:3] <-lapply(solutions[1:3], mchoice2string)if(any(explanations[4:6] <0)) explanations[4:6] <-lapply(solutions[4:6], function(x) paste("$", x, "$", sep =""))```# Aufgabe[boxhist.csv](boxhist.csv) draw a histogram, and a boxplot.Based on the graphics, answer the following questions or check the correctstatements, respectively. _(Comment: The tolerance for numeric answers is$\pm`r tol`$, the true/false statements are either about correct or clearly wrong.)_```{r questionlist, echo = FALSE, results = "asis"}answerlist(unlist(questions), markup ="markdown")```</br></br></br></br></br></br></br></br></br></br># Lösung```{r boxplot_hist, echo = FALSE, results = "hide", fig.height = 4.5, fig.width = 9, fig.path = "", fig.cap = ""}par(mfrow =c(1, 2))boxplot(x, axes =FALSE)axis(2, at =signif(b$stats, 3), las =1)box()hist(x, freq =FALSE, main ="")rug(x)``````{r solutionlist, echo = FALSE, results = "asis"}answerlist(paste(unlist(explanations), ".", sep =""), markup ="markdown")```---Categories: - vis- eda- en- cloze