

April 28, 2023
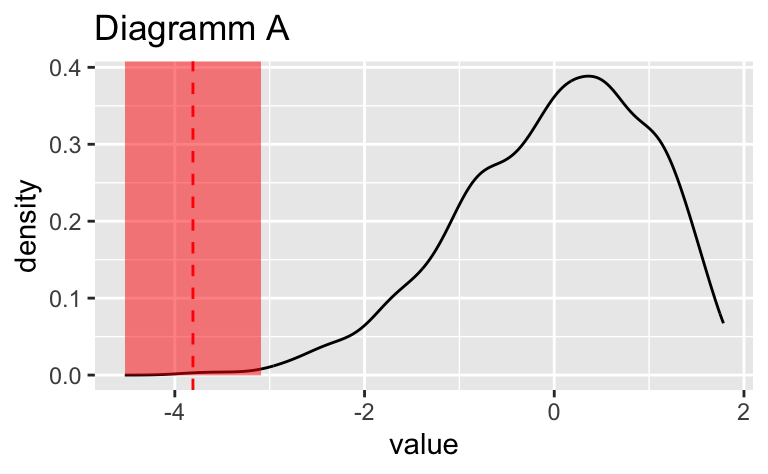
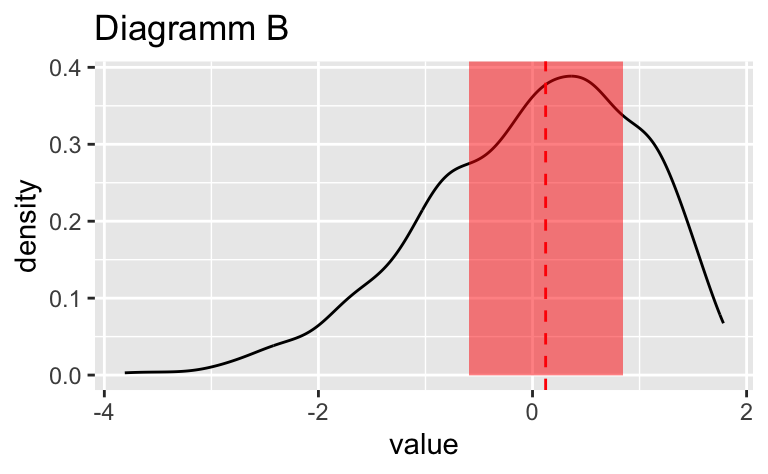
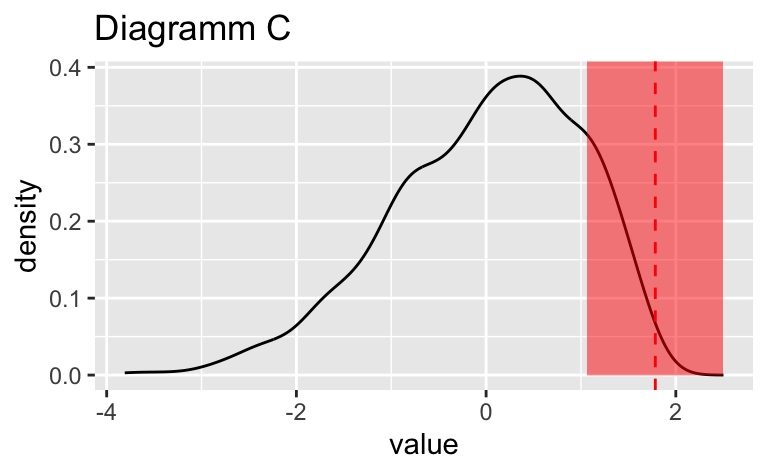
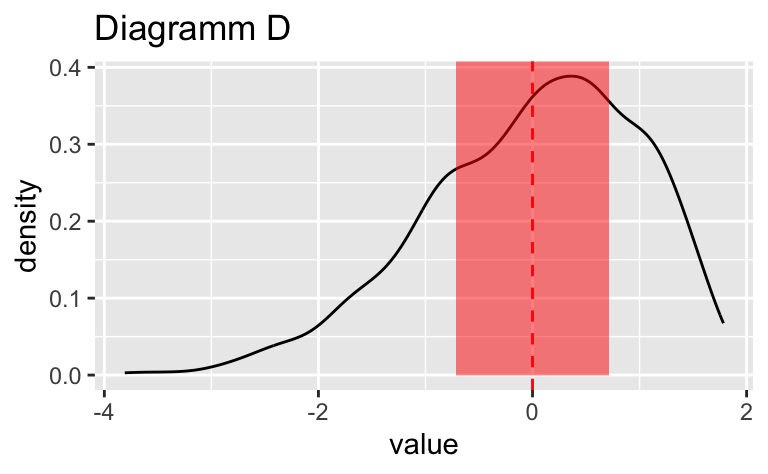
Wählen Sie das Diagramm, in dem der vertikale gestrichelte Linie am genauesten die Position des Medians (\(Md\)) widerspiegelt.


Das Diagramm B zeigt den Median am genauesten.
Categories:
---
exname: Streuung-Histogramm
extype: schoice
exsolution: r mchoice2string(sol_df$is_correct, single = TRUE)
exshuffle: no
categories:
- eda
- variability
- dyn
- schoice
date: '2023-04-28'
slug: Streuung-Histogramm
title: Streuung-Histogramm

---


```{r libs, include = FALSE}

library(tidyverse)
library(mosaic)
#library(testthat)
library(e1071)  # for skewness
library(glue)
library(exams)
```


```{r global-knitr-options, include=FALSE}
knitr::opts_chunk$set(fig.pos = 'H',
                      fig.asp = 0.618,
                      fig.width = 4,
                      fig.cap = "",
                      fig.path = "",
                      cache = FALSE)
```


# Aufgabe


```{r solution, echo = FALSE}
sol_set <- c(
             #"symm",
             # "uniform",
             "linksschief1", "linksschief2",
             "rechtsschief1", "rechtsschief2"
            #            ,"rechtsschief3"
             )

sol <- sample(sol_set, 1)
```


Wählen Sie das Diagramm, in dem der vertikale gestrichelte Linie am genauesten die Position des Medians ($Md$) widerspiegelt.


```{r generate-data, echo = FALSE}
n <- 1000

d_symm <- rnorm(n = n) %>% zscore() %>%  as_tibble()
d_left1 <- rbeta(n, 5, 2) %>% zscore() %>% as_tibble()
d_right1 <- rlnorm(n) %>% zscore() %>% as_tibble()

d_right2 <- rlnorm(n) %>% zscore()%>% as_tibble()
d_left2 <- -rexp(n, 10) %>% zscore()%>% as_tibble()

d_uniform <- runif(n = n) %>% zscore() %>% as_tibble()

# heavy (right) tailed pareto distribution:
qpareto <- function(u, a=0.8, b=1) b/(1-u)^(1/a)
rpareto <- function(n, a=0.8, b=1) qpareto(runif(n),a,b)

d_right3 <- rpareto(n) %>% zscore() %>% as_tibble()

d_raw <- tibble(
  data = list(
    #d_symm,
    #d_uniform,
    d_left1,
    d_left2,
    d_right1,
    d_right2
    #,d_right3
  )) %>%
  mutate(id = sol_set)


d <-
  d_raw %>%
  mutate(quantiles = map(data, ~ quantile(.x[[1]]))) %>%
  mutate(skew = map_dbl(data, ~ skewness(.x[[1]]))) %>%
  mutate(avg = map_dbl(data, ~ mean(.x[[1]]))) %>%
  mutate(iqr = map_dbl(data, ~ IQR(.x[[1]]))) %>%
  unnest_wider(quantiles) %>%
  sample_n(size = nrow(.))    # shuffle it


d_selected_distribution <-
  d %>%
  filter(id == sol)


d_selected_long <-
  d_selected_distribution %>%
  select(-c(id, skew, `75%`, `25%`)) %>%
  pivot_longer(-c(data, iqr)) %>%
    mutate(plot_id = LETTERS[1:nrow(.)])

```


```{r generate-histograms, echo = FALSE, message = FALSE, fig.show='hold', comment="", results="hide", warning=FALSE}

gg_hist <- function(data, plot_id, value, iqr) {
  ggplot(data = data) +
    aes(x = value) +
    geom_density() +
    ggtitle(glue("Diagramm {plot_id}")) +
    annotate("rect", xmin = value - iqr/2, xmax = value + iqr/2, ymin = 0, max = Inf, fill = "red", alpha = .5) +
    geom_vline(xintercept = value, linetype = "dashed", color = "red")
}


d_selected_long %>%
  select(-name) %>%
  pmap(gg_hist)

```


```{r compute-sol-df, echo = FALSE}
sol_df <-
d_selected_long %>%
  mutate(is_correct = name == "50%")

```


```{r questionlist, echo = FALSE, results = "asis"}
exams::answerlist(sol_df$plot_id, markup = "markdown")
```


</br>
</br>
</br>
</br>
</br>
</br>
</br>
</br>
</br>
</br>

# Lösung

Das Diagramm ``r sol_df$plot_id[sol_df$is_correct == TRUE]`` zeigt den Median am genauesten.


```{r solutionlist, echo = FALSE, results = "asis"}
exams::answerlist(ifelse(sol_df$is_correct, "Wahr", "Falsch"), markup = "markdown")
```


---

Categories:

- eda
- streuungsmaß
- variability
- dyn
- schoice