---
extype: schoice
expoints: 1
exsolution: r mchoice2string(solutions, single = TRUE)
exname: Linearitaet1a
categories:
- lm
- regression
- schoice
date: '2023-05-08'
slug: Linearitaet1a
title: Linearitaet1a

---


<!-- This question is based on Karsten Luebke's question "Linearitaet.Rmd". -->


```{r libs, include = FALSE}
library(mosaic)
library(exams)
```


```{r data generation, echo = FALSE, results = "hide"}
# Random Data
questions <- c("A", "B", "C", "D")
n <- 40
x <- runif(n, -5, 5)
z <- sample(questions, 4)
ya <- scale(sample(-5:5,1) + sample(c(-3,-2,-1,1,2,3),1) * x + rnorm(n))
yb <- scale(sample(-5:5,1) + sample(c(-3,-2,-1,1,2,3),1) * x^2 + rnorm(n))
yc <- scale(sample(-5:5,1) + sample(c(-3,-2,-1,1,2,3),1) * x^3 + rnorm(n))
yd <- scale(1/(1+exp(sample(c(-1,1),1)*x))+ 0.025 *rnorm(n))

data <- data.frame(x = rep(x,4), y = c(ya,yb,yc,yd), z = rep(z, each = n))


solutions <- rep(FALSE, 4)
solutions[which(z[1]==questions)] <- TRUE
```


# Aufgabe

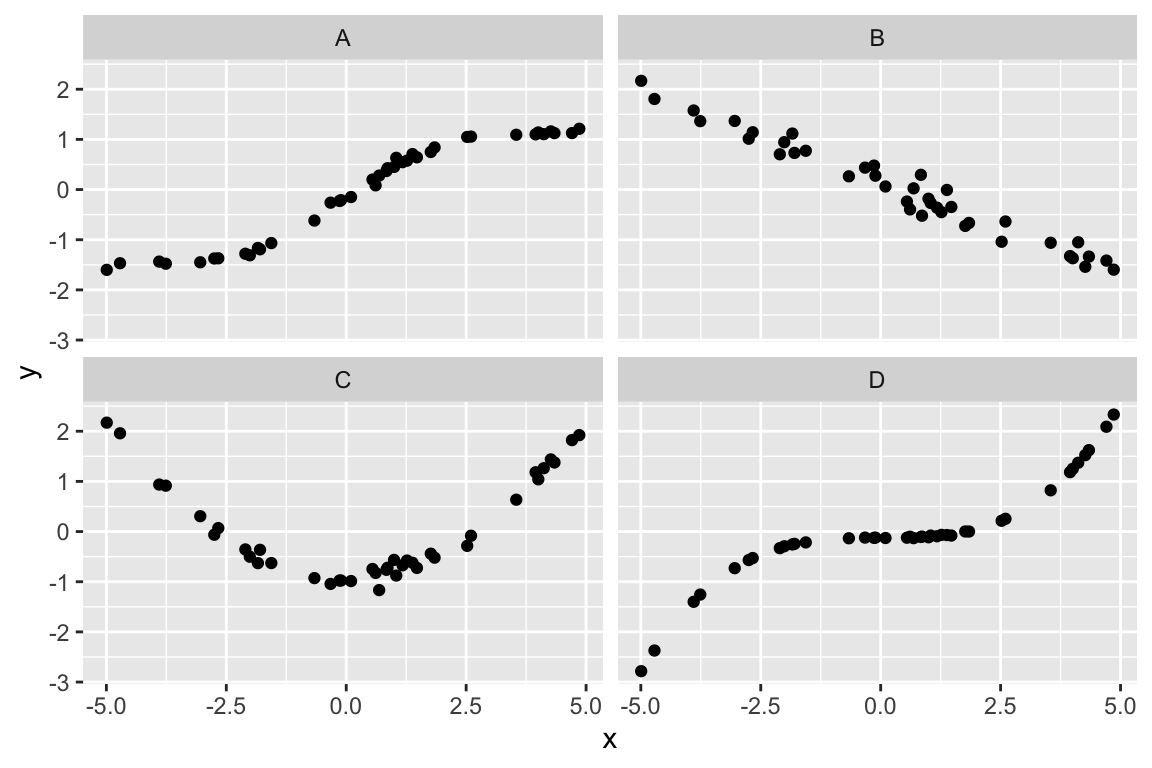
```{r show-histograms, echo = FALSE, results="hide", fig.height = 4, fig.width = 6, fig.cap = ""}
gf_point(y~x|z, data = data)
```

Bei welcher der Abbildungen ist eine Regression mit linearem Graph angemessen?

```{r questionlist, echo = FALSE, results = "asis"}
answerlist(questions, markup = "markdown")
```


</br>
</br>
</br>
</br>
</br>
</br>
</br>
</br>
</br>
</br>

# Lösung


```{r solutionlist, echo = FALSE, results = "asis"}
answerlist(ifelse(solutions, "Richtig", "Falsch"), markup = "markdown")
```


---

Categories:

- lm
- regression
- linear
- schoice
